Understanding Your Analysis
Balance Insights
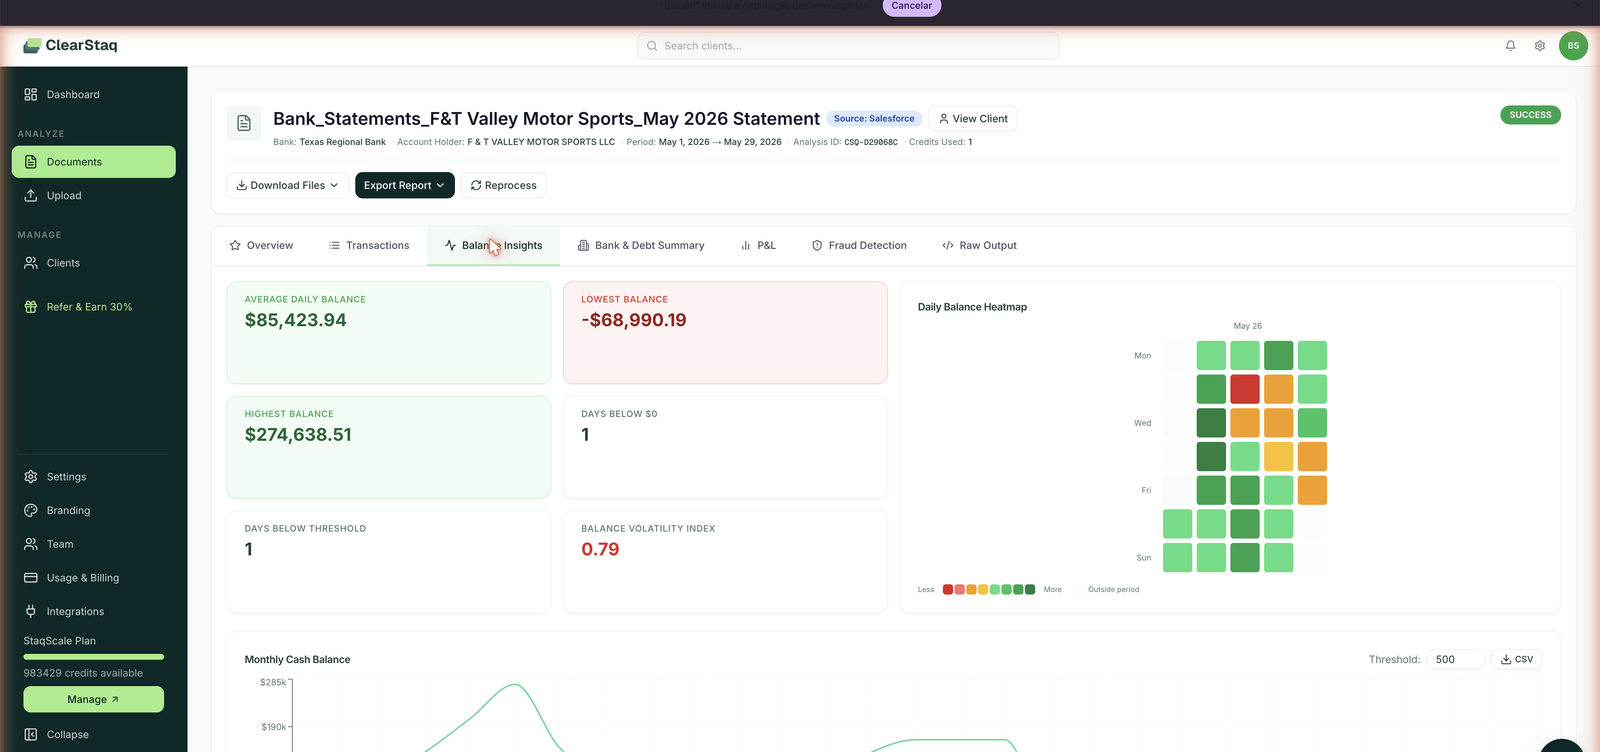
The Balance Insights tab on every analyzed document turns the statement's daily balances into pattern recognition you can do in seconds.
The metrics
| Metric | What it tells you |
|---|---|
| Average Daily Balance | The merchant's normal cash cushion |
| Lowest Balance | Worst single day — a deeply negative number (e.g. −$68,990) is a different conversation than a brief −$200 dip |
| Highest Balance | Upper bound; with the lowest, frames the swing range |
| Days Below $0 | How many days the account actually closed negative |
| Days Below Threshold | Days below your configurable cutoff (see below) |
| Balance Volatility Index | 0–1 score of balance stability. Near 0 = steady balances; near 1 = wild swings. High volatility with healthy averages means timing risk for fixed daily pulls. |
The daily balance heatmap
A calendar-grid heatmap of the statement period — each cell is a day, colored from red (negative/low) through yellow to deep green (high balance). Patterns jump out instantly:
- Red cells clustered before deposit days — the merchant runs dry between revenue events; daily-pull advances will bounce.
- A single red streak — one bad event (a large withdrawal, a seasonal dip) rather than chronic stress.
- Friday/weekend dips — payroll cycles eating the cushion.
Monthly cash balance chart + custom threshold
The balance trend is plotted for the full period with a configurable threshold line (default $500). Set the threshold to whatever your underwriting guideline requires — e.g. "must hold $2,500 minimum daily balance" — and the Days Below Threshold metric recomputes against your number.
The chart exports to CSV for your own models or for inclusion in a deal package.
How underwriters use this tab
- Check Days Below $0 and NSF count together — both zero on a 90-day window is a strong account.
- Set the threshold to your minimum-balance guideline and read days-below.
- Scan the heatmap for when lows happen — end-of-month lows with mid-month recovery is rhythm; random lows are instability.
- Use the Volatility Index to compare two merchants with similar averages — fund the steadier one, or price the volatile one accordingly.
FAQ
Where does daily balance data come from on statements that only print transactions? ClearStaq reconstructs end-of-day balances from the opening balance plus the parsed transaction ledger, validated against any printed daily-balance section.
Can I change the threshold permanently? The threshold is set per analysis view and recomputes instantly; your last value is kept on the page.
Is the heatmap exportable? The underlying daily balances export via the chart's CSV button; the heatmap itself is included in the Full Report PDF export.
What's a "good" volatility index? Lower is steadier. There's no universal cutoff — use it comparatively across your own book; retail merchants naturally run higher volatility than subscription businesses.