Understanding Your Analysis
The Analysis Overview: Every Metric Explained
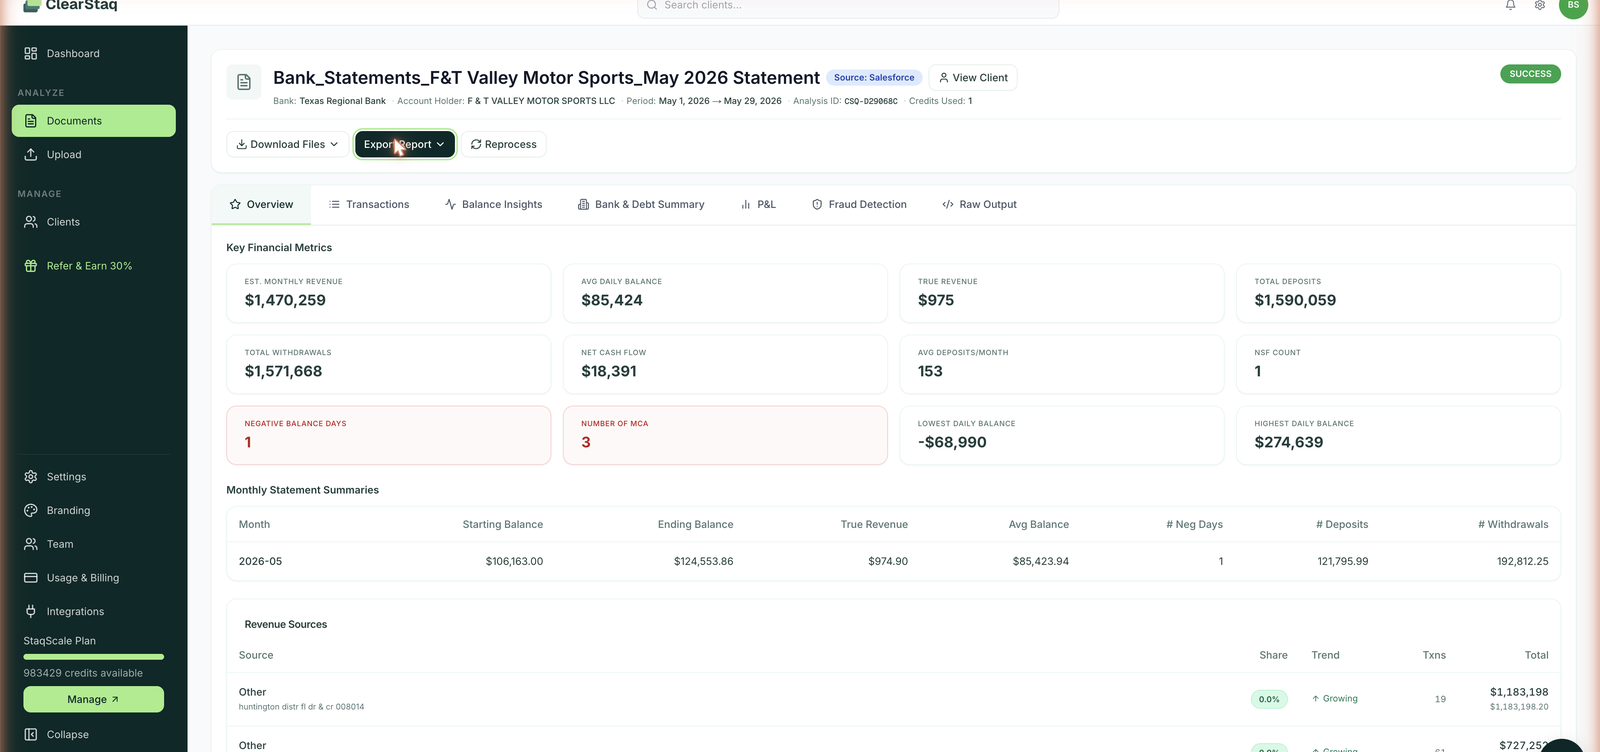
Open any analyzed document and you land on the Overview tab — twelve key financial metrics computed from the statement, followed by monthly summaries and revenue sources. This page defines every number exactly as ClearStaq computes it, and why it matters for an underwriting decision.
The document header
Above the metrics, every analysis shows: the source bank, account holder (as printed on the statement), statement period, a unique Analysis ID (e.g. CSQ-D29068C — use it when contacting support), credits used, and the source of the upload (web, email, API, or Salesforce).
Key financial metrics
| Metric | What it is | Why it matters |
|---|---|---|
| Est. Monthly Revenue | Total qualifying deposits normalized to a monthly figure | The headline number for sizing an advance or loan |
| True Revenue | Deposits minus non-qualifying inflows: MCA advance deposits, inter-account transfers, loan proceeds, reversals | The honest revenue figure. A merchant who received a $60K advance and made $40K in sales shows $100K in deposits — but $40K true revenue. Funding against gross deposits is how stacked deals get approved by mistake. |
| Avg Daily Balance | Mean end-of-day balance across the period | Cash cushion; primary repayment-capacity signal |
| Total Deposits / Total Withdrawals | Gross inflows and outflows for the period | Volume context for everything else |
| Net Cash Flow | Deposits minus withdrawals | Is the business accumulating or burning cash? |
| Avg Deposits/Month | Count of deposit transactions per month | Deposit frequency — 150 small daily deposits (retail) reads very differently from 3 large wires |
| NSF Count | Non-sufficient-funds items and fees detected | Direct evidence of cash stress; most funders have hard NSF limits |
| Negative Balance Days | Days the account closed below $0 | Stronger than NSF count — the account actually went negative |
| Number of MCA | Existing merchant cash advance positions detected | Stacking exposure — see Stacking Detection |
| Lowest / Highest Daily Balance | The extremes across the period | Worst-day exposure and volatility bounds |
Monthly Statement Summaries
One row per statement month: starting balance, ending balance, true revenue, average balance, negative days, deposit and withdrawal totals. For multi-month uploads this is your month-over-month trend at a glance — declining average balances with rising withdrawals is the classic pre-default pattern.
Revenue Sources
Every deposit stream identified on the statement, grouped by source, with:
- Share — percentage of total revenue
- Trend — Growing, Declining, or Stable across the period
- Transaction count and total
MCA-related deposits are excluded from revenue and labeled as excluded, so advance proceeds never inflate the revenue picture. Sources ClearStaq recognizes include card processors (Worldpay, merchant bankcard), financing programs (Yamaha Motor Finance, Synchrony), marketplace payouts, ACH streams, and plain cash deposits.
The other tabs
| Tab | What's there | Doc |
|---|---|---|
| Transactions | Searchable, filterable ledger of every parsed transaction | Transactions Explorer |
| Balance Insights | Daily balance heatmap, volatility index, threshold analysis | Balance Insights |
| Bank & Debt Summary | Monthly averages + the Stacking Detection Alert | Stacking Detection |
| P&L | Income and expense breakdown by category | P&L View |
| Fraud Detection | StaqGuard results for this document | Fraud Detection |
| Raw Output | The full analysis as JSON — copy or download | API & Webhooks |
FAQ
Why is True Revenue so much lower than total deposits on some statements? Because most of the deposits aren't revenue — they're transfers between the merchant's own accounts, advance proceeds, or loan disbursements. ClearStaq strips those out. That gap is the insight.
How is Est. Monthly Revenue different from True Revenue? Est. Monthly Revenue normalizes qualifying deposit volume to a monthly rate for sizing. True Revenue is the strict per-period figure after all exclusions. Use Est. Monthly Revenue for offer sizing, True Revenue for verification.
Can I see the math behind a metric? The Raw Output tab contains the complete computed summary as JSON — every figure on the Overview is there, plus the underlying data checks.
Do the metrics update if I upload more months? Each document keeps its own analysis. The client profile aggregates across all of the client's statements — see Client Profiles.