Revenue smoothing detection identifies when a business's bank statement deposits show artificial consistency — round numbers, suspiciously low variance, or temporal regularity that real business cash flow never produces. AI systems flag these patterns by applying Benford's Law, coefficient of variation analysis, and counterparty clustering across entire statement histories, catching manipulation that manual review routinely misses.
What you'll learn
- Artificially smoothed bank statements show a coefficient of variation below 0.15 across 12 months — real SMB businesses typically fall between 0.25 and 0.60
- Benford's Law analysis detects fabricated deposit sequences by measuring chi-square deviation from natural leading-digit distributions across the full transaction history
- Round-tripping — transferring funds out and back in to inflate apparent revenue — is exposed through counterparty concentration analysis and near-matched amount pattern matching
- Revenue smoothing and MCA stacking frequently co-occur, and their combination signals both over-leverage and active concealment — the highest-risk underwriting scenario
- AI analyzes 27 fraud signals simultaneously across a full statement history in seconds, while a human reviewer evaluating the same document in 20–30 minutes cannot replicate statistical benchmarking against thousands of comparable businesses
Revenue smoothing detection identifies when a business's bank statement deposits show artificial consistency — round numbers, suspiciously low variance, or temporal regularity that real business cash flow never produces. AI systems flag these patterns by applying Benford's Law, coefficient of variation analysis, and counterparty clustering across entire statement histories, catching manipulation that manual review routinely misses.
What Is Revenue Smoothing — and Why Should MCA Underwriters Care?
Revenue smoothing is the practice of artificially normalizing reported income to appear more stable or higher than reality. In corporate accounting, it often refers to legal timing adjustments — deferring revenue recognition or managing accruals to reduce earnings volatility. But in the MCA underwriting context, it means something far more serious: fabricating or manipulating actual deposit transactions to deceive lenders.
The distinction is critical. Corporate earnings management happens on income statements. Bank statement fraud happens at the transaction level — and that's exactly where MCA underwriters are supposed to have a clear view. Fraudsters know this, and they've adapted. According to the ACFE's 2024 Report to the Nations, financial statement fraud causes a median loss of $593,000 per incident — the highest of any occupational fraud category. In MCA, that exposure is direct and fast.
Legal Earnings Management vs. Fraudulent Smoothing
Legal income smoothing happens in the income statement — accrual adjustments, timing of revenue recognition, reserve manipulation. These techniques comply with GAAP and affect how profit is reported, not what actually lands in a bank account. Underwriters who review bank statements are supposed to bypass these accounting tricks entirely.
Fraudulent smoothing at the bank statement level is a different animal. Fraudsters add fictitious deposits, recycle funds between accounts, or use editing software to produce statements with consistent monthly totals that match what a lender wants to see. For a deeper look at the broader landscape of bank statement fraud in MCA lending, the patterns are becoming more sophisticated each year.
The MCA-Specific Risk: Daily Repayment Against Fabricated Revenue
MCA repayment is structured as a fixed daily or weekly ACH debit. The lender assumes a baseline cash flow level and sizes the advance accordingly. If that baseline was fabricated, the merchant can't sustain repayment from day one — it isn't a disclosure risk, it's a direct default risk.
Understanding true revenue vs. gross revenue is foundational here. Smoothed deposits inflate the apparent revenue base, causing lenders to overestimate repayment capacity. The advance is too large, the daily debit is too high, and the merchant defaults almost immediately. The fabrication doesn't just deceive — it structurally guarantees failure.
Real Growth vs. Artificial Patterns: How to Tell the Difference
Real business revenue is messy. Deposits arrive when customers pay — which means irregular amounts, variable timing, and natural variance tied to customers, seasons, and business cycles. A genuinely growing business still shows lumpy month-to-month cash flow, because real growth comes from winning new customers, landing larger contracts, or expanding into new markets. It doesn't arrive in smooth, evenly spaced increments.
Artificial patterns are statistically too clean. Variance is suppressed, round numbers dominate, and timing is too regular. These are not characteristics of any real business operating in the market — they're characteristics of someone building numbers to pass a review. The challenge for underwriters is that a well-constructed fabrication can look plausible to the eye. That's why quantitative tools are essential.
What Genuine Seasonal Variation Looks Like
Real seasonal businesses show predictable peaks and troughs tied to the calendar — retail surges in Q4, landscaping peaks in spring and summer, tax preparation services spike from January through April. But genuine seasonal patterns have internal consistency that fabricated ones often lack.
When revenue rises legitimately in a peak month, transaction counts increase, counterparty diversity expands, and individual payment amounts reflect more customers paying. Fabricated seasonal patterns often show higher deposit totals in "peak" months but the same counterparties paying larger lump sums — which doesn't reflect how real business volume scales. For a comprehensive treatment of how seasonal revenue patterns appear across a full 12-month statement history, the distinctions become clear quickly.
The Statistical Signature of Artificial Smoothing
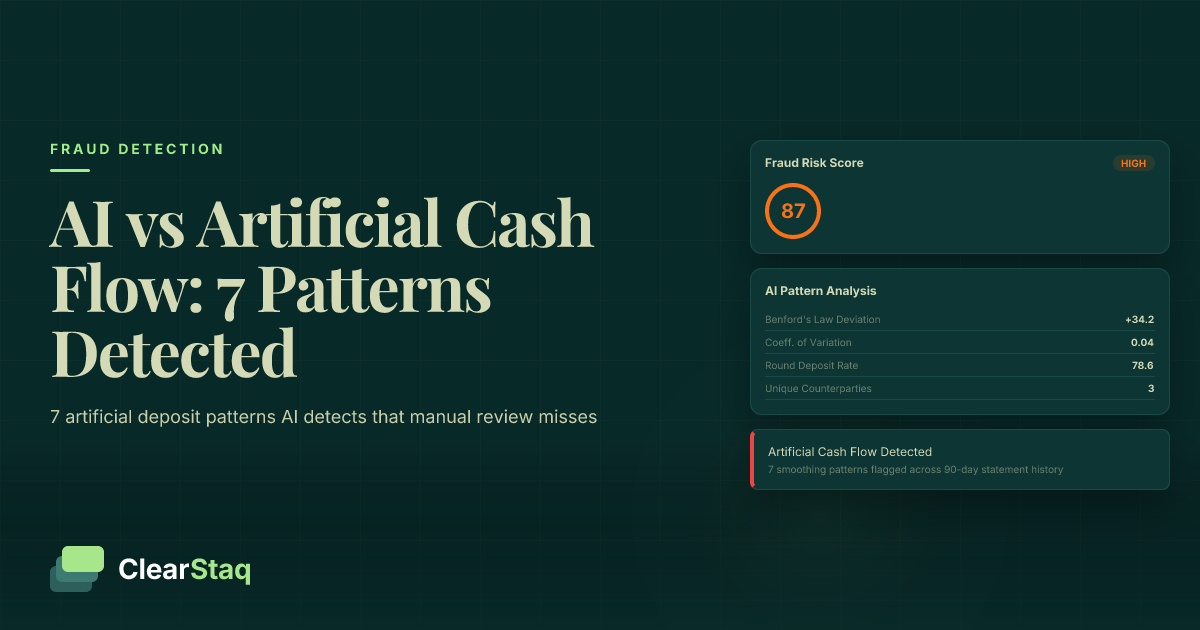
Artificially smoothed statements show a coefficient of variation (CV) below natural business thresholds. For most SMB categories, a CV below 0.15 across 12 months of monthly deposit totals is suspicious. Real businesses typically show CV between 0.25 and 0.60.
Beyond CV, artificial statements often show month-end deposit spikes followed by immediate withdrawals — a hallmark of fund recycling. Deposit amounts cluster at psychologically round numbers far more frequently than natural transactions. And week-over-week or month-over-month growth is too linear. Sound MCA cash flow analysis establishes the baseline benchmarks that make these deviations visible.
7 Artificial Cash Flow Patterns AI Detects in Bank Statements
These are the most common artificial cash flow patterns found in fraudulent bank statement submissions. Each pattern has a logic — fraudsters create it for a reason. No single pattern is conclusive on its own. It's the combination of signals that drives fraud score escalation, which is why AI analysis across the full statement history matters. These sit within the broader universe of bank statement fraud red flags AI detects, but cash flow pattern signals are among the most powerful for identifying fabricated revenue.
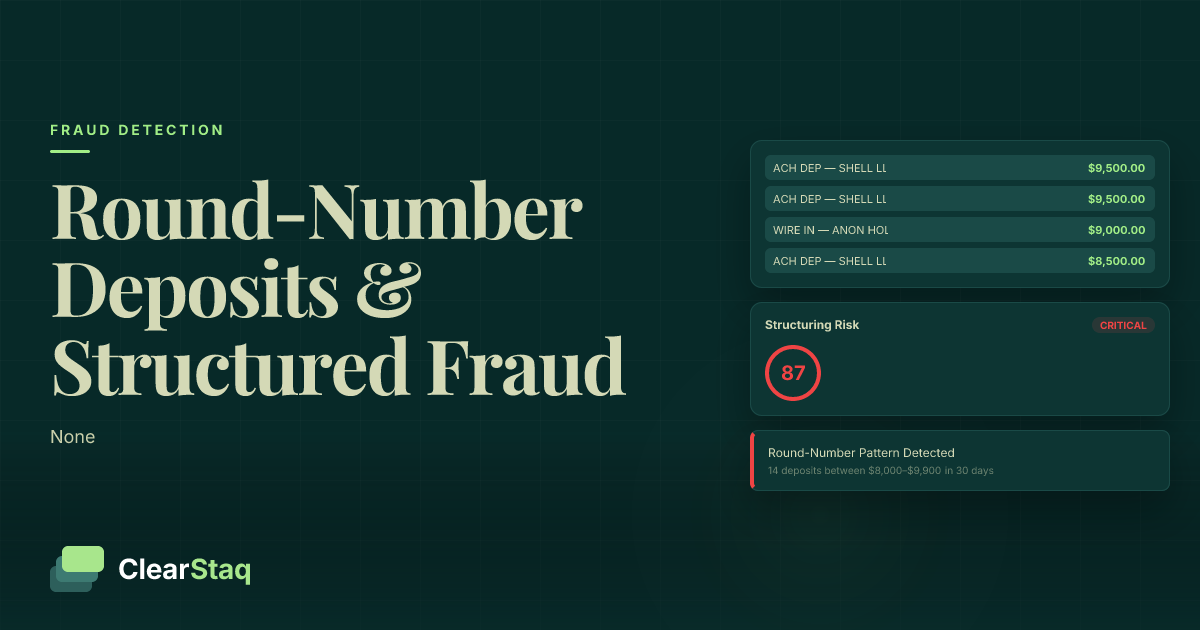
1. Round-Number Deposit Clustering
Real customer payments are irregular. A restaurant receives card settlements of $3,847.22. A contractor invoices $12,150.00 for a specific job. A retailer's daily deposit reflects what actually sold. Fraudsters building templates default to psychologically clean numbers — $5,000, $10,000, $25,000 — that look plausible but are statistically anomalous.
Benford's Law predicts the natural distribution of leading digits in financial data. Round numbers deviate from this distribution in predictable ways. AI detects this by calculating the proportion of deposits landing on multiples of $500 or $1,000 relative to benchmarks for the business category. A threshold of more than 35–40% of deposits clustering at round numbers in a 90-day window is a significant signal — and it's invisible to visual review.
2. Suspiciously Consistent Daily Balances
Real business checking accounts fluctuate dramatically day to day. Payroll runs, supplier invoices, rent payments, and irregular customer deposits create a natural variance that any operating business produces. Fabricated statements often show ending balances that stay within an unnaturally narrow band — always between $18,000 and $22,000, for example — because the fraudster built the statement to a target balance rather than simulating actual cash flow dynamics.
The quantitative flag: standard deviation of daily ending balance below a business-size-adjusted threshold. The internal logic test: if deposit and withdrawal activity is supposedly high but the balance barely moves, the math doesn't work. That contradiction is detectable in seconds.
3. Temporal Regularity That Defies Business Reality
Real deposits arrive when customers pay — which is irregular, lumpy, and tied to invoice cycles, card processing schedules, or walk-in sales. Fabricated deposits often appear on the same day each week or the same dates each month with suspicious precision. Deposits arriving on exactly the 1st, 8th, 15th, and 22nd of every month for 12 consecutive months with no variation isn't a business — it's a schedule.
Temporal clustering analysis measures the standard deviation of inter-deposit intervals. Real businesses show high variance; fabricated ones show low variance. AI adjusts benchmarks by business type — a retail business with daily card processing will naturally show more regular timing than a B2B contractor — so the comparison is always category-specific.
4. Deposit-to-Withdrawal Ratio Anomalies
Every business has a natural ratio of outflows to inflows tied to its cost structure and industry. A restaurant at a 65% cost-of-revenue ratio will show outflows that reflect food, labor, and overhead. A service business may show higher margins but still has predictable expense patterns.
In fabricated statements, fraudsters often inflate deposits while underrepresenting realistic operating expenses. The result is a deposit-to-withdrawal ratio that's implausibly favorable — margins that no legitimate business in that category achieves. AI cross-references industry-level benchmarks to flag merchants whose stated margins aren't credible. It also flags the inverse: heavy outflows right before a statement period ends, which can indicate preparation for fund recycling in the next cycle.
5. Round-Tripping: Money That Leaves and Returns
Round-tripping is the practice of transferring funds out of an account and then transferring them back in — inflating apparent revenue without any actual business activity. In bank statements, this appears as large outgoing transfers followed within days by equivalent or near-equivalent incoming deposits from a different-seeming source.
Fraudsters use multiple accounts — sometimes at different banks — to obscure the circular path of funds. AI detects round-tripping by flagging matched or near-matched transfer amounts within rolling time windows, typically three to 14 days. This is closely related to duplicate transaction detection, where circular fund movements inflate apparent revenue through overlapping accounting of the same cash.
6. Missing Variance During Known Business Cycles
Most business sectors have known stress periods — Q1 slowdowns for retail, off-season months for seasonal businesses, the impact of documented economic events. Real bank statements show dips during these periods. Fabricated ones often show implausibly smooth performance through periods where comparable businesses experienced decline.
The absence of a signal is itself a detection signal. A restaurant showing flat $85,000 monthly deposits through a documented regional weather event that shut down foot traffic for two weeks hasn't been validated — it's been fabricated. This detection requires analysis across the full 12-month statement history, not just the most recent three months that many manual reviews focus on.
7. Counterparty Concentration in Deposits
Real businesses receive deposits from a diverse range of customers, card processors, platforms, and payment aggregators. Fabricated statements often show deposits coming from a very small number of counterparties — or the same counterparty repeatedly with different amounts.
A counterparty concentration ratio above 60–70% (where 1–2 sources account for most deposits) warrants scrutiny unless the business model clearly explains it. A staffing agency on a single government contract might legitimately show concentration; a restaurant claiming diverse walk-in traffic shouldn't. Combined with round-number amounts, counterparty concentration is a high-confidence fraud signal — and it's often the thread that unravels round-tripping schemes.
As the visualization above shows, no single signal determines the outcome. Each pattern contributes a weighted signal to the composite cash flow authenticity score. It's the combination — round-number clustering plus temporal regularity plus counterparty concentration — that pushes the score into high-risk territory with statistical confidence.
See Revenue Smoothing Detection in Action
ClearStaq analyzes 27 fraud signals — including all 7 cash flow patterns above — across a full statement history in seconds. Upload a bank statement and get an instant fraud score with signal-level breakdown. Start your free trial — no credit card required.
The Math Behind the Detection: Benford's Law and Statistical Anomalies
Visual inspection can catch crude fabrications. It can't catch sophisticated ones. A fraudster who has reviewed underwriting checklists knows to avoid obvious formatting errors and conspicuous round numbers in large deposits. What they can't do is replicate the statistical properties of naturally occurring financial data — because human beings aren't wired to generate Benford-compliant, appropriately variable sequences intuitively.
The statistical methods described below have been used in enterprise auditing and forensic accounting for decades. What's changed is that they're now applied at the transaction level, across entire statement histories, in real time. They're part of the broader set of 27 fraud signals that AI-based systems analyze simultaneously — and understanding the math helps underwriters interpret the signals they receive.
How Benford's Law Exposes Fabricated Numbers
Benford's Law states that in naturally occurring numerical data — financial transactions, population figures, river lengths — the leading digit is 1 approximately 30% of the time, 2 about 17%, 3 about 12.5%, and so on in a logarithmic distribution. The probability decreases as the leading digit increases.
Fabricated data tends to show a more uniform distribution of leading digits. Humans don't intuitively generate Benford-compliant sequences. We gravitate toward "plausible" round numbers and underrepresent the digit 1 as a leading digit because it feels too small. Applied to bank statement deposits, AI calculates the chi-square deviation from the expected Benford distribution across all transactions. A significant deviation — typically p < 0.05 — across a 3-month or 12-month deposit history is a strong fabrication indicator. Benford's analysis is most powerful in combination with other signals, since very small transaction sets can produce natural deviation by chance.
Standard Deviation Analysis of Deposit Sequences
Standard deviation of deposit amounts over rolling 30-day, 90-day, and 12-month windows is compared against benchmarks for the merchant's business category and revenue size band. Unnaturally low standard deviation indicates that deposit amounts are too consistent — a hallmark of template-generated statements.
The same analysis applies to deposit timing: the standard deviation of inter-deposit intervals reveals temporal regularity that no naturally operating business produces. As a practical example: a restaurant processing $80,000 per month should show deposit standard deviation of approximately $8,000–$15,000. A standard deviation below $2,000 is suspicious regardless of how the deposits look at a glance.
Coefficient of Variation Benchmarks for Real Businesses
The coefficient of variation (CV) normalizes variance across different revenue scales by dividing standard deviation by the mean. This makes it possible to compare the "naturalness" of cash flow patterns across businesses of very different sizes.
| Business Category | Typical CV Range (Monthly Deposits, 12-Month) | Suspicious Below |
|---|---|---|
| Retail (brick and mortar) | 0.25 – 0.55 | 0.15 |
| Restaurant / Food Service | 0.20 – 0.45 | 0.12 |
| Construction / Contractor | 0.40 – 0.75 | 0.20 |
| E-Commerce | 0.15 – 0.40 | 0.10 |
| Professional Services | 0.30 – 0.60 | 0.15 |
| Seasonal Business | 0.50 – 0.90 | 0.25 |
A CV below 0.15 across 12 months suggests artificial smoothing for most SMB categories. A CV above 0.80 may indicate volatile or distressed cash flow — a different risk signal. The key insight is that AI applies category-adjusted thresholds, not a single universal cutoff, which reduces both false positives and false negatives significantly.
The heatmap above illustrates how Benford deviation, CV anomaly, and standard deviation signals vary in intensity across the statement timeline — making visible the specific months where fabrication signals concentrate, which is itself informative about when the manipulation was introduced.
How Revenue Smoothing and MCA Stacking Often Go Hand in Hand
MCA stacking is the practice of obtaining multiple cash advances from different lenders simultaneously without disclosing existing positions. It's a significant risk in its own right — but it frequently co-occurs with revenue smoothing, and understanding why reveals a lot about how fraud operates at the operational level.
A merchant who is already over-leveraged from stacking has two problems: their real cash flow can't support another advance, and their existing ACH debit obligations will be visible in their bank statement. Revenue smoothing solves both problems simultaneously. It inflates apparent revenue to justify the new advance and, in more sophisticated fabrications, suppresses visibility of outgoing ACH debits that would reveal existing positions.
How Stacking Fraudsters Manipulate Statements to Hide Position
Existing MCA repayments appear as daily or weekly ACH debits — often in the $300–$2,500 range, depending on the advance size. These debits reduce net cash flow significantly and are visible patterns that trained underwriters recognize. To hide stacking, fraudsters either remove existing ACH debit lines entirely or inflate deposits to mask the net cash flow impact.
AI detects this by cross-referencing deposit inflation timing with ACH debit appearance dates. When a statement shows a clean period with healthy deposits followed by an abrupt appearance of recurring ACH debits — or when the deposit pattern changes character in the three months prior to submission — the discontinuity is a strong indicator that the submitted period was selectively manipulated. Merchants often smooth only the window submitted to the new lender while leaving prior months unaltered, creating a visible statistical break.
The Combined Risk Score: When Two Fraud Patterns Appear Together
When both revenue smoothing signals and stacking indicators appear together, default probability is significantly higher than either signal alone. Stacking combined with smoothing means a merchant who is both over-leveraged and actively concealing it — the highest-risk combination an underwriter can encounter.
This isn't additive risk — it's multiplicative. The merchant has already demonstrated both the motive and the capability to deceive. Underwriters should treat co-occurrence as an immediate escalation trigger. For the full treatment of how MCA stacking detection works from bank statement analysis alone, the specific ACH debit patterns and timing signals are documented in detail.
Manual Review vs. AI-Powered Detection: Why the Gap Is Growing
This isn't about replacing experienced underwriters. It's about acknowledging what manual review structurally cannot do — and what happens when fraud sophistication outpaces the detection method. The hidden cost of manual bank statement review isn't just time — it's the systematic blind spots that experienced fraudsters have learned to exploit.
An experienced underwriter reviewing a 12-month statement in 20–30 minutes is working with pattern recognition built from their own caseload. AI analyzing 27 signals across a full statement history in seconds is working from benchmarks built across thousands of comparable businesses. These are structurally different capabilities.
What a Human Reviewer Catches
Human reviewers are effective at catching first-generation fabrications. They identify obvious visual anomalies — formatting inconsistencies, font changes, visible PDF artifacts. They catch narrative inconsistencies, like a business claiming to be seasonal but showing no seasonal variation. They notice gross balance errors where running balance math doesn't add up. They flag high-value single transactions that are disproportionate to the stated business size.
These are real skills, and they catch real fraud. The problem is that fraudsters who have submitted statements to multiple lenders have learned what these checks look for — and they've adapted accordingly.
What AI Catches That Humans Miss
The signals that sophisticated fabrications are specifically designed to avoid are exactly the ones that require quantitative analysis to detect:
- Benford's Law deviations — invisible to the eye but detectable in milliseconds
- Subtle temporal regularity — a human can't calculate the standard deviation of 180 inter-deposit intervals during a document review
- Counterparty concentration across a full year — requires systematic tabulation that's impractical manually
- Cross-statement benchmarking — AI compares against thousands of similar businesses; a human reviewer has only their own experience
- Sophisticated round-tripping — where amounts are near-matched but not identical, requiring pattern matching across hundreds of transactions
- Missing variance during known industry stress periods — detecting the absence of expected signals requires a complete industry benchmark dataset
Speed and Scale: The Case for Automation
MCA brokers and direct lenders process dozens to hundreds of applications daily. Manual deep-review of every statement at the same depth isn't feasible — which means some applications receive more scrutiny than others, and sophisticated fraudsters can game that variability.
AI-based screening solves this by analyzing every statement at the same depth, in seconds. Human reviewers focus their attention on flagged cases rather than performing first-pass analysis on every submission. The real-time fraud alerts fire before the underwriter opens the file — so by the time a human reviews a flagged application, they're validating a specific signal, not searching for one.
How ClearStaq Identifies Artificial Cash Flow in Real Time
The workflow above shows what happens from the moment a statement is uploaded. ClearStaq's fraud detection platform parses the document, extracts transaction-level data, and runs the full signal stack simultaneously — returning a composite fraud score with individual signal breakdown within seconds. This isn't a black-box verdict. Every flagged signal includes the specific transactions or patterns that triggered it.
The Revenue Smoothing Signal Stack
Within ClearStaq's 27 fraud signals, the cash flow pattern subset directly addresses revenue smoothing detection. These signals run simultaneously across the full statement history:
- Benford's Law chi-square score — calculated across the full transaction history, flagging leading-digit distribution anomalies
- CV calculation against category-adjusted benchmarks — normalized variance compared to the merchant's specific business category and revenue band
- Temporal regularity score — inter-deposit interval standard deviation measured against business-type benchmarks
- Round-number clustering ratio — proportion of deposits landing on multiples of $500 or $1,000 relative to category norms
- Counterparty concentration index — deposit source diversity measurement flagging concentrated or circular fund flows
- Deposit-to-withdrawal ratio — cross-referenced against industry margin benchmarks
Each signal contributes to a composite cash flow authenticity score returned via API. The broader bank statement fraud red flags AI detects — including document-level signals like PDF metadata anomalies and font consistency — run in parallel, so cash flow pattern signals are combined with document integrity signals for the most complete picture.
From Upload to Flag in Seconds
The workflow is straightforward: a PDF is uploaded via API or web interface, parsed through ClearStaq's 900+ bank format library, fraud signals are scored across the full transaction history, and the result is returned with flagged signals highlighted. The 900+ bank format support means smoothing detection works consistently whether the statement comes from Chase, Bank of America, or a regional credit union — no format-specific blind spots.
Integration with existing underwriting workflows happens via webhook: the fraud flag fires before the underwriter opens the file. When a reviewer does open a flagged application, they see both the composite score and the specific transactions that triggered each signal — enabling informed human judgment rather than algorithmic override. The entire audit trail is SOC2-compliant, so lenders can demonstrate exactly which signals drove an adverse action decision.
What Underwriters Should Do When Smoothing Is Flagged
A fraud flag isn't an automatic decline. It's a structured prompt for follow-up. The appropriate response depends on the number and confidence level of signals triggered. Treating every flag as a decline ignores legitimate businesses that may trigger individual signals for benign reasons. Treating every flag as ignorable defeats the purpose. The right framework is tiered.
Tier 1: Single Signal — Request Additional Documentation
A single smoothing signal — mildly elevated round-number clustering, for example — warrants a documentation request, not an automatic decline. Many legitimate businesses have some unusual cash flow characteristics that can be explained by their specific business model.
The documentation request should include: business bank statements from a different period (ideally the 12 months prior to the submitted window), tax returns for the overlapping period, and merchant processing statements if applicable. The key cross-reference is cross-referencing bank statements with tax returns — if IRS Schedule C or business tax return revenue aligns with bank statement deposits, that's meaningful corroboration. Document the flag and the documentation request in the underwriting file for audit purposes.
Tier 2: Multiple Signals — Escalate and Verify
Two or more co-occurring smoothing signals warrant escalation to a senior underwriter or dedicated fraud team. At this tier, documentation requests alone aren't sufficient — independent verification is required.
Contact the business's bank directly (with merchant authorization) to confirm deposit totals. Request bank-issued statements directly rather than relying on merchant-provided PDFs. Pull the merchant from MCA industry databases to identify existing advance positions. If stacking indicators are also present, escalate immediately to Tier 3 — the co-occurrence of smoothing and stacking signals is the highest-risk combination.
Tier 3: High-Confidence Fraud Flag — Decline and Document
Three or more co-occurring signals, or any single high-confidence signal — confirmed round-tripping, Benford deviation at p < 0.01, or direct evidence of statement editing — warrants decline. The documentation requirements at this tier are specific and important.
- Document all fraud signals in the underwriting record with the AI signal report attached
- Adverse action notice must comply with applicable regulations — consult the FTC's guidance on small business lending fraud for the legal framework
- Consider reporting to industry fraud databases to protect other lenders from the same application
- Retain the flagged statement and signal report in the loan file for potential regulatory audit
This tiered approach protects both the lender and legitimate applicants. It creates a defensible audit trail, reduces false decline rates, and ensures that the highest-confidence fraud cases receive the firm response they warrant. The broader picture of bank statement fraud in MCA lending makes clear that systematic documentation and industry-level reporting are part of what controls the problem over time.
Frequently Asked Questions
What is revenue smoothing in the context of MCA lending?
In MCA lending, revenue smoothing refers to the manipulation of actual bank statement deposits to make a business's cash flow appear more stable, consistent, or higher than it really is. Unlike legal accounting smoothing — which adjusts how income is reported on financial statements — bank statement-level smoothing fabricates or alters real transaction data to deceive underwriters evaluating repayment capacity.
How do underwriters detect artificial cash flow patterns?
The most reliable detection combines statistical analysis with business-context benchmarking. Key methods include Benford's Law analysis of leading-digit distribution across deposits, coefficient of variation benchmarking against industry norms, temporal clustering analysis of deposit intervals, counterparty concentration measurement, and deposit-to-withdrawal ratio comparison. AI systems apply all of these simultaneously across the full statement history, which is why they catch patterns that manual review misses.
What are round-number deposits and why are they a fraud signal?
Real business deposits reflect what customers actually paid — irregular amounts driven by real transactions. When deposits cluster heavily at psychologically clean round numbers like $5,000, $10,000, or $25,000, it suggests template-generated entries rather than organic business activity. Benford's Law predicts the natural distribution of leading digits in financial data; round-number clustering deviates from this distribution in ways that AI can measure with statistical precision.
What is the difference between seasonal revenue variation and artificial smoothing?
Genuine seasonal variation shows predictable peaks and troughs tied to calendar events, with corresponding changes in transaction count, counterparty diversity, and individual payment amounts. Artificial smoothing shows suspiciously consistent monthly totals regardless of season — or fabricated seasonal patterns where the volume rises but the underlying transaction characteristics don't change. The coefficient of variation across a full 12-month history distinguishes the two: seasonal businesses show high natural CV; smoothed statements show artificially suppressed CV.
Can AI detect cash flow manipulation that was designed to avoid detection?
Yes — this is precisely the advantage of statistical analysis over visual review. Sophisticated fabrications are specifically designed to avoid the visual red flags that manual underwriters look for. What they can't replicate is the statistical signature of naturally occurring financial data: Benford-compliant leading digit distributions, appropriate variance in deposit timing and amounts, and the organic counterparty diversity that real business activity produces. AI detects the absence of these natural properties even when the fabrication looks convincing to the eye.
How many fraud signals are needed to confidently identify revenue smoothing?
No single signal is conclusive on its own. A mildly elevated round-number clustering ratio might warrant a documentation request. Two co-occurring signals warrant escalation. Three or more simultaneous signals — or any one signal at very high confidence, like a Benford deviation at p < 0.01 — warrant decline. The combination of signals is what drives confidence, which is why multi-signal AI analysis is more reliable than any individual indicator applied in isolation.
Ready to Catch Revenue Smoothing Before It Costs You?
ClearStaq's fraud detection engine analyzes 27 signals — including Benford's Law, CV benchmarking, temporal clustering, and counterparty analysis — across every statement you receive, in seconds. Stop relying on visual review for patterns that are designed to survive it. Start your free trial today — no credit card required.
Frequently Asked Questions
What is revenue smoothing in the context of MCA lending?
In MCA lending, revenue smoothing refers to the manipulation of actual bank statement deposits to make a business's cash flow appear more stable, consistent, or higher than it really is. Unlike legal accounting smoothing — which adjusts how income is reported on financial statements — bank statement-level smoothing fabricates or alters real transaction data to deceive underwriters evaluating repayment capacity.
How do underwriters detect artificial cash flow patterns?
The most reliable detection combines statistical analysis with business-context benchmarking. Key methods include Benford's Law analysis of leading-digit distribution across deposits, coefficient of variation benchmarking against industry norms, temporal clustering analysis of deposit intervals, counterparty concentration measurement, and deposit-to-withdrawal ratio comparison. AI systems apply all of these simultaneously across the full statement history, which is why they catch patterns that manual review misses.
What are round-number deposits and why are they a fraud signal?
Real business deposits reflect what customers actually paid — irregular amounts driven by real transactions. When deposits cluster heavily at psychologically clean round numbers like $5,000, $10,000, or $25,000, it suggests template-generated entries rather than organic business activity. Benford's Law predicts the natural distribution of leading digits in financial data; round-number clustering deviates from this distribution in ways that AI can measure with statistical precision.
What is the difference between seasonal revenue variation and artificial smoothing?
Genuine seasonal variation shows predictable peaks and troughs tied to calendar events, with corresponding changes in transaction count, counterparty diversity, and individual payment amounts. Artificial smoothing shows suspiciously consistent monthly totals regardless of season — or fabricated seasonal patterns where volume rises but underlying transaction characteristics don't change. The coefficient of variation across a full 12-month history distinguishes the two: seasonal businesses show high natural CV; smoothed statements show artificially suppressed CV.
Can AI detect cash flow manipulation that was designed to avoid detection?
Yes — this is precisely the advantage of statistical analysis over visual review. Sophisticated fabrications are specifically designed to avoid the visual red flags that manual underwriters look for. What they can't replicate is the statistical signature of naturally occurring financial data: Benford-compliant leading digit distributions, appropriate variance in deposit timing and amounts, and the organic counterparty diversity that real business activity produces. AI detects the absence of these natural properties even when the fabrication looks convincing to the eye.
How many fraud signals are needed to confidently identify revenue smoothing?
No single signal is conclusive on its own. A mildly elevated round-number clustering ratio might warrant a documentation request. Two co-occurring signals warrant escalation. Three or more simultaneous signals — or any one signal at very high confidence, like a Benford deviation at p < 0.01 — warrant decline. The combination of signals is what drives confidence, which is why multi-signal AI analysis is more reliable than any individual indicator applied in isolation.
ClearStaq Team
Product Team
The ClearStaq team builds AI-powered tools for bank statement parsing, fraud detection, and income verification.