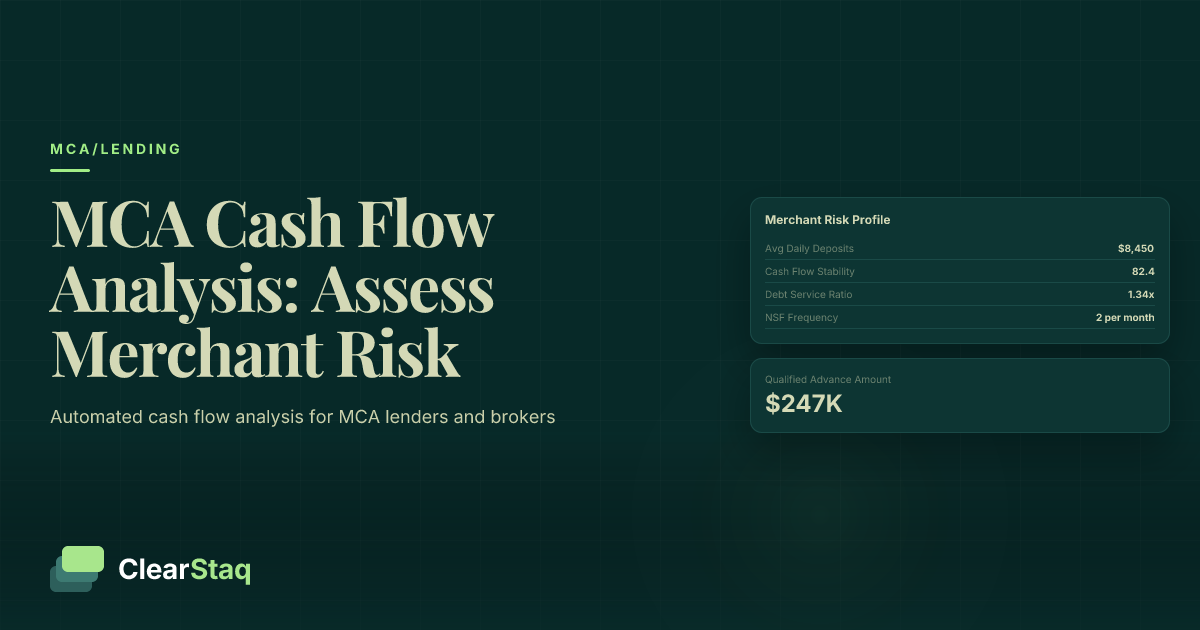
MCA cash flow analysis evaluates merchant bank statements to assess repayment ability through key metrics like daily deposit average, cash flow stability, and debt service coverage ratios. Modern automated tools extract and analyze 90 days of transactions across multiple accounts, identifying patterns and risks that manual review often misses.
What you'll learn
- MCA cash flow analysis focuses on daily sales patterns rather than monthly income like traditional lending
- Daily Deposit Average (DDA), cash flow stability, and debt service coverage ratios are the three critical metrics
- Automated analysis reduces processing time from 2-4 hours to under 30 seconds per application
- Seasonal businesses require separate peak and trough period analysis for accurate risk assessment
- Red flags include declining revenue trends, high NSF fees, and irregular deposit patterns
MCA cash flow analysis evaluates merchant bank statements to assess repayment ability through key metrics like daily deposit average, cash flow stability, and debt service coverage ratios. Modern automated tools extract and analyze 90 days of transactions across multiple accounts, identifying patterns and risks that manual review often misses.
What Is MCA Cash Flow Analysis?
MCA cash flow analysis is the process of evaluating merchant bank statements to determine whether a business can handle daily or weekly merchant cash advance repayments. Unlike traditional lending that focuses on monthly income and credit scores, MCA analysis dives deep into daily sales patterns and cash flow consistency.
This specialized form of underwriting examines the rhythm of a business's deposits and withdrawals to predict future payment capacity. By analyzing 90 days of transaction history, lenders can identify revenue patterns, assess financial stability, and calculate sustainable payment amounts that won't strain the merchant's operations.
MCA vs Traditional Lending Analysis
Traditional lenders evaluate businesses based on annual revenue, credit scores, and collateral value. They look at monthly or quarterly financials and make decisions based on historical performance and asset coverage. MCA lenders take a fundamentally different approach.
MCA cash flow analysis focuses on daily sales velocity rather than monthly averages. This revenue-based assessment examines deposit frequency, transaction volumes, and cash flow timing to determine how much a business can afford to pay back each day. There's no collateral evaluation — it's purely about the predictability and sustainability of daily cash flows.
Why Bank Statements Are Critical for MCAs
Bank statements provide the most accurate picture of a merchant's real-time business performance. Unlike tax returns that show last year's results or profit-loss statements that can be manipulated, bank statements reveal exactly what's happening in the business today.
These documents show daily sales deposits, operating expenses, and existing debt obligations — everything needed to assess repayment capacity. For businesses with multiple revenue streams or seasonal fluctuations, bank statements capture the complete cash flow story that other documents miss.
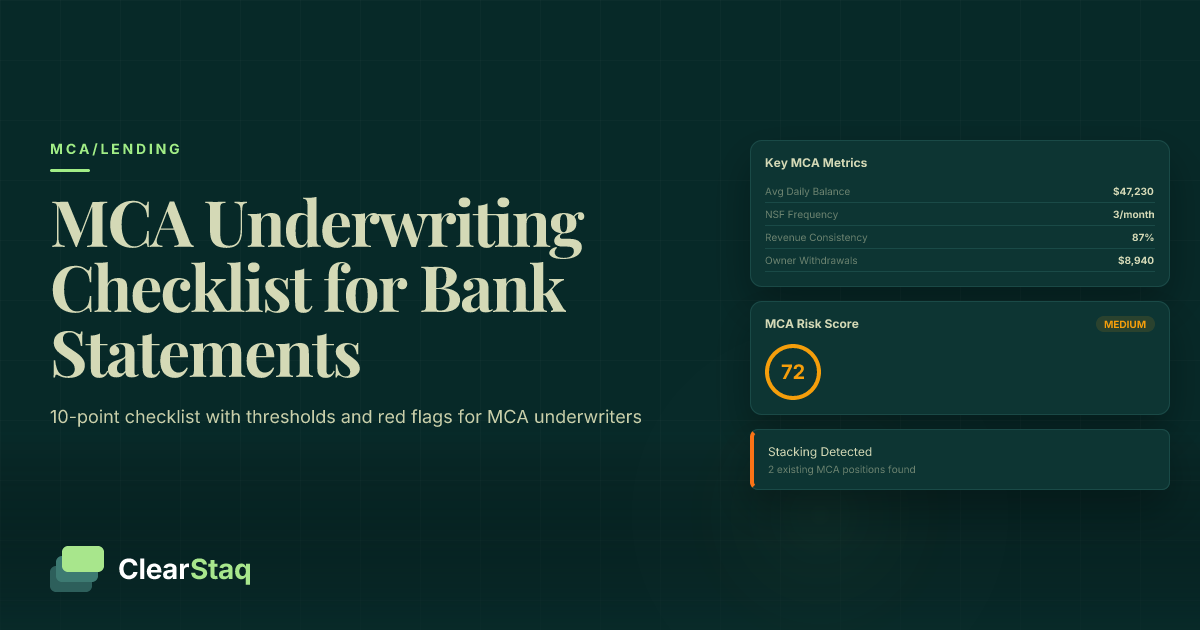
Most importantly, bank statements enable lenders to verify that reported sales match actual deposits. This validation is crucial for preventing fraud and ensuring the sustainability of the MCA arrangement. For a comprehensive approach to this verification process, see our complete MCA underwriting checklist.
Key Cash Flow Metrics for MCA Underwriting
Successful MCA underwriting relies on four critical metrics that paint a complete picture of merchant financial health. These metrics work together to determine not just if a merchant qualifies, but what payment structure makes sense for their business.
Understanding these metrics helps lenders make faster, more accurate decisions while reducing default risk. Each metric serves a specific purpose in the overall risk assessment framework.
Daily Deposit Average (DDA)
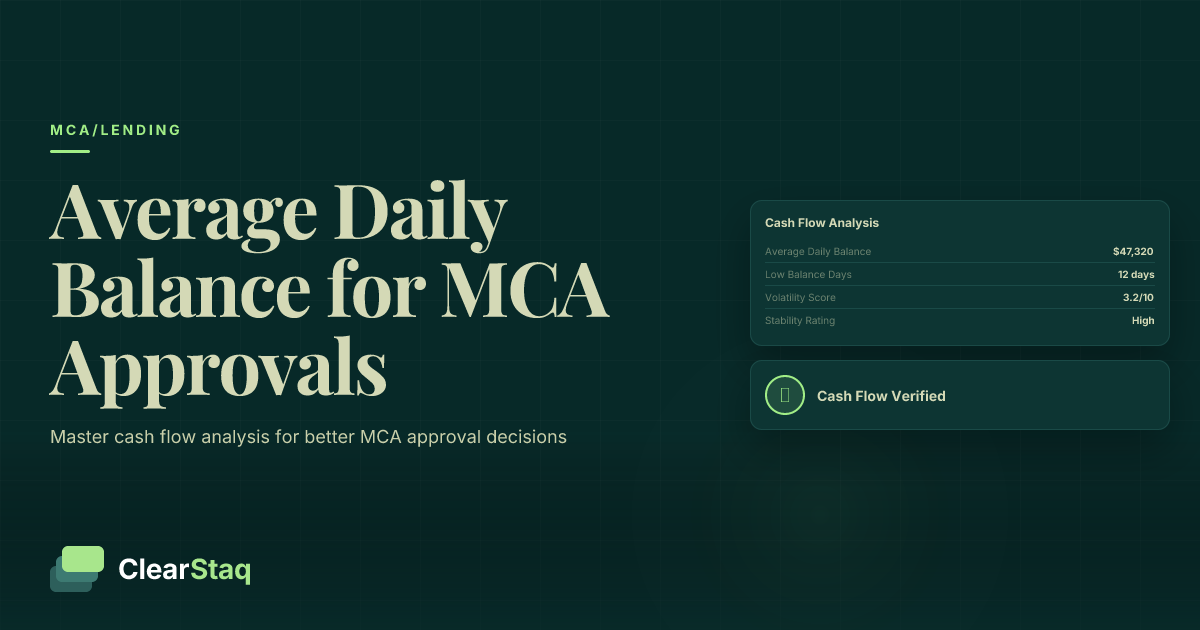
The Daily Deposit Average is the cornerstone of MCA cash flow analysis. Calculate it by summing all business deposits over 90 days and dividing by the number of business days in that period. This metric represents the average daily revenue flowing into the merchant's account.
When calculating DDA, adjust for weekends and holidays based on the merchant's operating schedule. A restaurant open seven days needs different calculations than a B2B company closed on weekends. Also consider seasonal variations — a 90-day average during peak season might not represent year-round capacity.
Most MCA lenders set maximum payment amounts at 10-15% of DDA to ensure merchants maintain adequate operating cash. This conservative approach protects both parties from cash flow stress.
Cash Flow Stability Metrics
Cash flow stability measures how consistent a merchant's deposits are over time. Calculate the standard deviation of daily deposits to quantify this variability. A lower standard deviation indicates more predictable revenue, which reduces lending risk.
The coefficient of variation (standard deviation divided by mean) provides a normalized stability score. Merchants with coefficients below 0.5 typically qualify for better rates, while those above 1.0 may face restrictions or higher factor rates due to unpredictable cash flows.
Trend analysis adds another dimension to stability assessment. Look for consistent growth, stable plateaus, or concerning declines over the 90-day period. Even stable averages can hide dangerous downward trends that threaten future repayment ability.
Debt Service Coverage Ratios
The Debt Service Coverage Ratio (DSCR) for MCAs measures whether a merchant generates enough cash to cover all debt obligations, including the proposed advance. Calculate it by dividing net operating cash flow by total debt payments.
For MCA underwriting, most lenders require a minimum DSCR of 1.25x, meaning the business generates 25% more cash than needed for debt payments. High-risk industries might require 1.5x or higher. This cushion protects against unexpected revenue drops or expense increases.
Remember to include all existing MCAs, loans, and fixed obligations in the calculation. Many merchants have multiple funding sources, and overlooking existing debt is a common cause of defaults.
This business demonstrates strong financial health with consistent cash flow and minimal overdraft activity. Recommended for approval with standard terms.
Step-by-Step Cash Flow Analysis Process
A systematic approach to cash flow analysis ensures consistency and accuracy across all applications. This process transforms raw bank statement data into actionable lending decisions through four distinct phases.
Data Extraction and Validation
The analysis begins with extracting transaction data from bank statements. Modern bank statement parsing technology can process hundreds of different bank formats, converting PDFs into structured data within seconds.
Data validation ensures completeness and accuracy. Check for missing pages, verify beginning and ending balances match across statements, and confirm all dates are accounted for. OCR technology handles scanned documents, while native PDF extraction provides higher accuracy for digital statements.
Quality checks flag potential issues like duplicate transactions, missing data, or suspicious patterns that might indicate document tampering. This validation step catches problems early, before they impact analysis accuracy.
Transaction Analysis
Once data is extracted, categorize each transaction to understand cash flow sources and uses. Deposit pattern recognition identifies regular customer payments versus one-time events like loans or asset sales that shouldn't factor into DDA calculations.
Expense categorization reveals the merchant's cost structure and identifies concerning patterns. High payment processing fees might indicate chargebacks, while increasing rent or payroll shows business expansion. Look for unusual expense spikes that could signal financial distress.
Cash flow timing analysis examines when money comes in versus when it goes out. Businesses with tight timing margins face higher risk of NSF fees and payment defaults. Map the typical weekly cash flow cycle to understand pressure points.
Trend and Pattern Identification
Trend analysis reveals the business trajectory beyond simple averages. Calculate month-over-month growth rates and identify acceleration or deceleration patterns. A business with 20% monthly growth presents different risks than one declining at the same rate.
Seasonal pattern recognition requires comparing current performance to historical norms. Many businesses have predictable busy and slow seasons. Understanding these patterns helps structure payments that align with cash flow reality rather than forcing unsustainable flat payments year-round.
Day-of-week analysis uncovers operational patterns. Restaurants might see 40% of weekly revenue on weekends, while B2B companies concentrate deposits Monday through Wednesday. These patterns inform payment scheduling and risk assessment.
Red Flags to Watch For in Merchant Bank Statements
Identifying warning signs early prevents costly defaults and protects both lenders and merchants from unsustainable funding arrangements. These red flags often appear in combinations, creating risk patterns that experienced underwriters recognize immediately.
Revenue and Deposit Red Flags
Declining daily averages over the 90-day period signal business deterioration. While temporary dips happen, consistent month-over-month declines indicate systemic problems. Calculate the linear regression of daily deposits — a negative slope warrants deeper investigation.
Inconsistent deposit timing suggests operational instability or customer payment issues. Regular businesses develop predictable deposit patterns. When these patterns break down, it often precedes larger problems. Watch for increasing gaps between deposits or shifts from daily to sporadic patterns.
Round number deposits raise fraud concerns. Real business deposits rarely end in perfect hundreds. Multiple $500, $1,000, or $2,500 deposits might indicate manufactured transactions designed to inflate DDA. This manipulation technique is one of many covered in our guide to detecting fake bank statements.
Expense and Fee Red Flags
High NSF frequency reveals chronic cash flow problems. More than 2-3 NSF fees monthly indicates the business operates too close to zero balance. Calculate NSF fees as a percentage of gross deposits — anything above 0.5% suggests serious cash management issues.
Excessive overdraft fees point to even deeper problems than NSF charges. Businesses relying on overdraft protection to meet obligations face imminent failure risk. Track both frequency and total overdraft amounts to assess severity.
Multiple loan payments eating up daily cash flow create unsustainable debt burdens. Add up all identifiable loan, MCA, and credit card payments. If total debt service exceeds 30% of gross deposits, the merchant likely can't handle additional funding without defaulting on existing obligations.
Cash Flow Timing Issues
End-of-month cash crunches appear as systematic balance drops in the last week of each month. This pattern suggests the business struggles to meet monthly obligations like rent, payroll, or loan payments. These merchants often seek MCAs to bridge recurring gaps rather than fund growth.
Weekly cash flow gaps between deposits and withdrawals create operational stress. Map daily balances to identify regular shortfalls. Businesses that consistently hit zero balance mid-week face higher NSF risk and operational disruption from payment timing mismatches.
Seasonal distress patterns emerge when comparing year-over-year performance. A business showing 40% revenue drops during slow season versus 20% historically faces amplified risk. These expanded fluctuations often indicate competitive pressure or operational problems beyond normal seasonality.
Manual vs. Automated Cash Flow Analysis
The difference between manual and automated cash flow analysis can mean hours of work versus minutes, and the distinction goes far beyond time savings. Modern automated systems deliver consistency, accuracy, and insights that manual processes simply can't match.
Manual Analysis Challenges
Manual data entry from bank statements into Excel consumes 2-4 hours per application. Analysts must transcribe hundreds of transactions, categorize them, and build formulas to calculate metrics. This tedious process invites errors — studies show 1-5% error rates in manual data entry.
Human error compounds through the analysis process. A miskeyed deposit amount throws off DDA calculations. Missed transactions skew cash flow patterns. Inconsistent categorization makes trend analysis unreliable. These errors lead to bad lending decisions that cost far more than any automation investment.
Perhaps worst, manual analysis lacks consistency. Different analysts use different methods, categorize transactions differently, and may calculate metrics using varying formulas. This inconsistency makes it impossible to compare applications fairly or track portfolio performance accurately.
Automated Analysis Benefits
Automated extraction pulls data from bank statements in seconds, not hours. Modern bank statement extraction software handles hundreds of bank formats, recognizes transaction patterns, and categorizes entries consistently every time.
Consistent calculations eliminate formula errors and ensure every application gets evaluated using identical metrics. Automated systems apply the same business rules, categorization logic, and risk scoring across thousands of applications. This consistency enables better portfolio management and risk prediction.
Multi-account aggregation becomes trivial with automation. Instead of manually combining data from multiple statements, automated systems instantly merge accounts, eliminate transfers between accounts, and provide consolidated cash flow views. This complete picture reveals risks that single-account analysis misses.
ROI of Automation
Time savings alone justify automation investments. Reducing analysis time from 3 hours to 5 minutes means processing 36 applications in the time previously needed for one. This efficiency enables faster decisions and higher volume without adding staff.
Improved decision accuracy drives the real ROI. Automated analysis catches patterns humans miss, like subtle fraud indicators or complex multi-account cash flow manipulation. Better decisions mean fewer defaults, which directly impact portfolio performance and profitability.
Scalability benefits multiply over time. Manual processes hit capacity limits quickly — hiring and training analysts takes months. Automated systems scale instantly to handle volume spikes, enabling growth without proportional cost increases.
See ClearStaq's Automated Analysis in Action
Watch how ClearStaq transforms 90 days of bank statements into comprehensive cash flow analysis in under 30 seconds. Book a demo to see instant extraction, risk scoring, and fraud detection working together.
How to Handle Seasonal and Variable Cash Flows
Seasonal businesses present unique challenges for MCA underwriting. Their cash flows swing dramatically between peak and slow seasons, making standard DDA calculations potentially misleading. Smart analysis adapts to these patterns rather than forcing square pegs into round holes.
Seasonal Pattern Recognition
Identifying seasonal patterns requires at least 12 months of historical data. Plot monthly revenues to visualize peaks and troughs. Retail businesses might see 40% of annual revenue in November-December, while landscapers peak in summer months. These patterns repeat predictably year after year.
Industry-specific patterns guide expectations. Ice cream shops, tax preparers, vacation rentals, and holiday decoration stores all follow predictable seasonal cycles. Compare the merchant's pattern to industry norms — significant deviations warrant investigation.
Holiday and event impacts create micro-seasons within broader patterns. Restaurants near stadiums see spikes during game days. Flower shops peak around Valentine's Day and Mother's Day. Understanding these patterns enables more accurate cash flow prediction and appropriate payment structuring.
Adjusted Metrics for Seasonal Businesses
Calculate separate DDAs for peak and slow seasons rather than using a simple 90-day average. A Christmas tree farm showing $1,000 daily deposits in December but $100 in July needs seasonal adjustment. Use the lower figure for payment calculations to ensure year-round sustainability.
Peak versus trough analysis quantifies seasonal variation. Calculate the ratio between highest and lowest monthly revenues. Ratios above 3:1 indicate extreme seasonality requiring special payment structures. Consider percentage-of-revenue payments rather than fixed daily amounts for these merchants.
Cash flow smoothing techniques help seasonal businesses manage MCA payments. Some lenders offer stepped payment plans — lower payments during slow seasons, higher during peak times. Others use holdback percentages that automatically adjust to sales volumes. These structures align payments with cash flow reality.
How ClearStaq Automates MCA Cash Flow Analysis
ClearStaq transforms the complex process of cash flow analysis into a streamlined, automated workflow. By combining advanced data extraction with sophisticated analytics and fraud detection, ClearStaq enables lenders to make faster, more accurate funding decisions.
Automated Data Extraction
ClearStaq supports over 900 bank statement formats, automatically recognizing and extracting data from PDFs regardless of bank or format variations. This comprehensive coverage eliminates manual data entry and ensures consistent extraction across all major financial institutions.
The platform uses both OCR and native PDF processing to maximize accuracy. Native PDF extraction achieves 99.5% accuracy on digital statements, while advanced OCR handles scanned documents with industry-leading precision. Built-in validation checks verify data completeness and flag potential issues before analysis begins.
Data cleaning happens automatically, standardizing transaction descriptions, categorizing entries, and identifying transfers between accounts. This clean, structured data provides the foundation for accurate cash flow analysis without manual intervention.
Advanced Analytics Engine
Real-time metric calculations deliver instant insights as soon as statements are uploaded. DDA, cash flow stability scores, debt service ratios, and trend analyses appear within seconds. These calculations update dynamically as additional accounts or time periods are added.
Pattern recognition algorithms identify complex behaviors that manual review often misses. The system detects seasonal patterns, flags unusual transactions, and identifies revenue manipulation attempts. Machine learning continuously improves pattern detection based on portfolio outcomes.
Predictive cash flow modeling forecasts future performance based on historical patterns and industry benchmarks. These projections help structure sustainable payment plans and identify merchants likely to experience future cash flow stress.
Integrated Risk Assessment
ClearStaq combines cash flow analysis with comprehensive fraud detection, analyzing fraud detection signals simultaneously with financial metrics. This integrated approach catches sophisticated fraud schemes that might show acceptable cash flows but hide underlying document manipulation.
The platform examines 27 distinct fraud signals including PDF metadata, font consistency, mathematical accuracy, and behavioral patterns. This multi-layered detection prevents losses from both poor cash flow and fraudulent applications.
Comprehensive risk scoring weighs all factors — cash flow metrics, fraud signals, industry risk, and seasonal patterns — into unified risk scores. These scores enable consistent decision-making across underwriting teams and support automated decision workflows for qualified applications.
Best Practices for MCA Risk Assessment
Successful MCA lending requires disciplined processes and comprehensive risk assessment. These best practices, refined through millions of funded advances, help lenders minimize defaults while serving merchants effectively.
Data Collection Standards
Require 90 days minimum of bank statements to capture meaningful patterns. Shorter periods might miss seasonal variations or hide developing problems. Some lenders request 6 months for seasonal businesses or 12 months for startups without established patterns.
Include all business accounts in the analysis. Merchants sometimes split activity across multiple accounts to manipulate metrics or hide obligations. Request statements for all accounts receiving business deposits or paying business expenses. Cross-reference deposit amounts to catch account splitting.
Verify statement completeness before analysis. Check page sequences, confirm beginning balances match prior ending balances, and ensure no days are missing. Incomplete statements often hide negative information and should trigger requests for complete documentation.
Analysis Documentation
Maintain detailed audit trails of all analysis decisions. Document which accounts were analyzed, what adjustments were made for seasonality or unusual items, and how final metrics were calculated. This documentation supports portfolio reviews and regulatory examinations.
Record decision rationales beyond just metrics. Note why certain risks were accepted, what mitigating factors influenced approvals, and what conditions were placed on funding. This context proves invaluable when reviewing portfolio performance or handling disputes.
Compliance requirements demand consistent documentation across all applications. Use standardized forms and checklists to ensure nothing gets missed. Regular audits verify that documentation standards are being maintained and that decisions align with stated credit policies.
For lenders ready to modernize their approach, ClearStaq's MCA lending solutions provide the technology foundation for implementing these best practices at scale.
Frequently Asked Questions
How do you analyze cash flow for MCA underwriting?
MCA cash flow analysis involves calculating daily deposit averages from 90 days of bank statements, assessing cash flow stability through variance analysis, and determining debt service coverage ratios. The process focuses on daily sales patterns rather than monthly income like traditional loans.
What metrics matter most in merchant cash flow analysis?
The three critical metrics are Daily Deposit Average (DDA) calculated over 90 days, cash flow stability ratio measuring deposit consistency, and debt service coverage ratio ensuring adequate cash flow for MCA payments. Most lenders require a minimum 1.25x coverage ratio.
How do you handle seasonal businesses in cash flow analysis?
Seasonal businesses require 12-month historical analysis to identify peak and trough periods. Calculate separate DDAs for high and low seasons, adjust risk scoring for seasonal patterns, and structure payment schedules to align with cash flow cycles.
What are the biggest cash flow risks for MCA lenders?
Major risks include declining revenue trends over 90 days, high NSF fees indicating cash flow stress, irregular deposit patterns suggesting business instability, and excessive existing debt payments that reduce available cash flow for new MCA obligations.
How do you analyze multiple bank accounts for one merchant?
Aggregate all business accounts to get complete cash flow picture, verify no account splitting to hide transactions, calculate combined DDA across all accounts, and ensure consistency in deposit patterns across accounts. Modern tools automate this multi-account analysis.
Transform Your MCA Underwriting Today
Transform your MCA underwriting with automated cash flow analysis. ClearStaq extracts, analyzes, and scores merchant risk in seconds — not hours.
Frequently Asked Questions
How do you analyze cash flow for MCA underwriting?
MCA cash flow analysis involves calculating daily deposit averages from 90 days of bank statements, assessing cash flow stability through variance analysis, and determining debt service coverage ratios. The process focuses on daily sales patterns rather than monthly income like traditional loans.
What metrics matter most in merchant cash flow analysis?
The three critical metrics are Daily Deposit Average (DDA) calculated over 90 days, cash flow stability ratio measuring deposit consistency, and debt service coverage ratio ensuring adequate cash flow for MCA payments. Most lenders require a minimum 1.25x coverage ratio.
How do you handle seasonal businesses in cash flow analysis?
Seasonal businesses require 12-month historical analysis to identify peak and trough periods. Calculate separate DDAs for high and low seasons, adjust risk scoring for seasonal patterns, and structure payment schedules to align with cash flow cycles.
What are the biggest cash flow risks for MCA lenders?
Major risks include declining revenue trends over 90 days, high NSF fees indicating cash flow stress, irregular deposit patterns suggesting business instability, and excessive existing debt payments that reduce available cash flow for new MCA obligations.
How do you analyze multiple bank accounts for one merchant?
Aggregate all business accounts to get complete cash flow picture, verify no account splitting to hide transactions, calculate combined DDA across all accounts, and ensure consistency in deposit patterns across accounts. Modern tools automate this multi-account analysis.
ClearStaq Team
Product Team
The ClearStaq team builds AI-powered tools for bank statement parsing, fraud detection, and income verification.