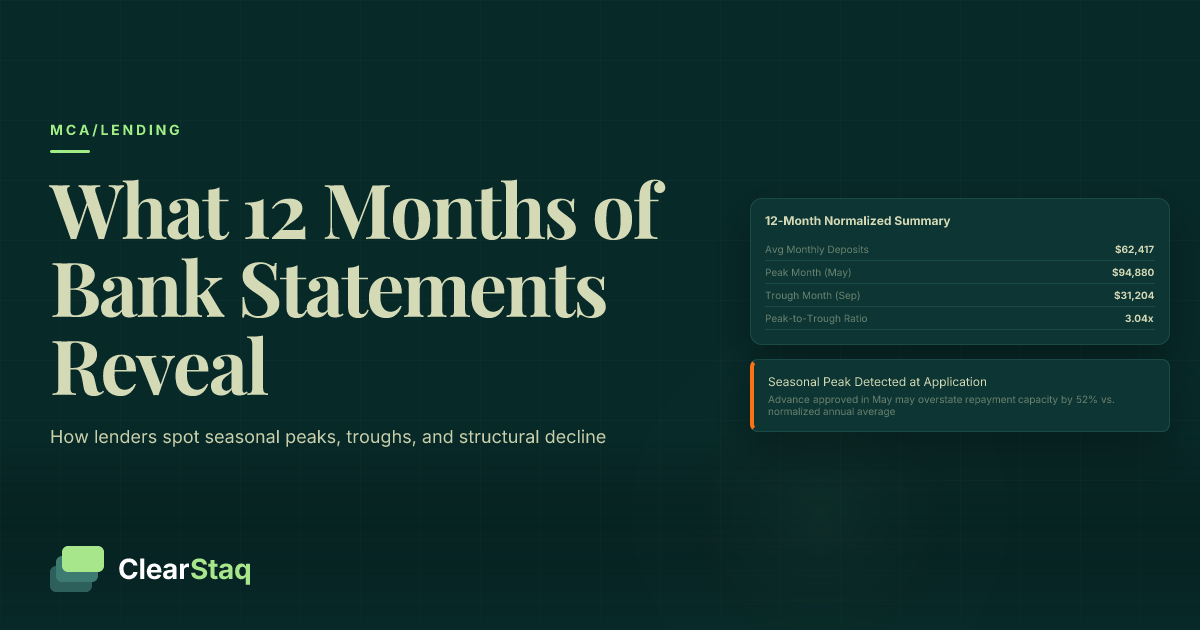
Twelve months of bank statements reveal a business's full seasonal revenue cycle — identifying peak deposit months, trough periods, average daily balance trajectory, and whether cash flow dips reflect normal seasonality or structural decline. Underwriters use this 12-month view to calculate normalized average monthly revenue, assess MCA repayment capacity, and avoid approving advances at misleading seasonal peaks.
What you'll learn
- A 12-month bank statement review surfaces the full seasonal arc — ramp-up, peak, decline, trough, and recovery — that a 3-month snapshot systematically misses
- Normalized average monthly revenue calculated via a trimmed mean excluding the top and bottom 2 months produces a more accurate repayment capacity baseline than a simple average
- Daily MCA remittance should not exceed 15–20% of average daily balance in the lowest 3 months of the review period to remain serviceable year-round
- Structural decline is distinguished from seasonal dips by year-over-year erosion in peak-month deposits, even when the seasonal pattern itself remains visible
- Automated parsing generates a full 12-month deposit trend analysis in seconds, eliminating the tabulation errors that cause two manual reviewers to reach different revenue figures from the same file
Twelve months of bank statements reveal a business's full seasonal revenue cycle — identifying peak deposit months, trough periods, average daily balance trajectory, and whether cash flow dips reflect normal seasonality or structural decline. Underwriters use this 12-month view to calculate normalized average monthly revenue, assess MCA repayment capacity, and avoid approving advances at misleading seasonal peaks.
Why 12 Months of Bank Statements Matter More Than 3
Three months of bank statements capture a snapshot in time. For a seasonal business, that snapshot is almost always misleading — it hits either a peak or a trough, not the full picture. The revenue a landscaper shows in June looks nothing like what their account holds in January. An underwriter relying on a 3-month window will either dramatically overestimate or underestimate repayment capacity.
A 12-month view changes everything. It surfaces the full seasonal arc: the ramp-up, the peak, the decline, the trough, and the recovery. That arc is the real business. And it's the only reliable basis for calculating normalized average monthly revenue — the figure that should actually drive underwriting decisions for seasonal files.
Regulators and sophisticated lenders increasingly require 12 months of statements for seasonal industries, precisely because the 3-month snapshot creates systematic risk. The US Census Bureau's monthly retail trade data makes it clear how dramatic seasonal swings can be — holiday-quarter retail sales routinely run 30–40% above the annual monthly average. Approving loans based on that quarter alone sets up borrowers and lenders for failure.
The Seasonal Peak Trap: Why 3-Month Reviews Mislead Underwriters
Consider a landscaping business that applies for an MCA in June. Their 3-month review covers April, May, and June — peak season. Gross deposits show $80,000 per month. The underwriter sizes a daily remittance accordingly.
But December through February tells a very different story: deposits may drop to $15,000–$20,000 per month. The daily ACH remittance sized to $80,000 capacity becomes unserviceable during winter months. Default risk spikes — not because the business failed, but because the underwriting was anchored to the wrong number.
A full 12-month review of that same landscaper would show a true average closer to $42,000–$45,000 per month. That's the number that should drive the advance size and repayment structure. The average daily balance calculation across all 12 months is equally important — it reveals whether the business maintains meaningful cash reserves through the off-season or runs its account near zero by February.
What a Full Year of Deposit Data Actually Contains
Twelve months of statements aren't just 12 copies of the same data. Each month contributes distinct signals:
- Month-by-month gross deposit totals — the raw revenue curve across all seasons
- Average daily balance trajectory — whether the business builds and preserves cash reserves or depletes them through the off-season
- NSF and overdraft clustering by month — which months push the account into distress, and whether that's isolated or recurring
- Recurring vs. one-time deposit signals — separating predictable operating revenue from loan proceeds, transfers, or one-time windfalls
Together, these signals give underwriters a complete financial fingerprint — not a single-frame photo, but a full-year film.
The Most Common Seasonal Revenue Patterns by Industry
Seasonal revenue curves aren't random. Each industry follows a recognizable pattern that experienced underwriters can benchmark against. When an applicant's deposit curve deviates significantly from their industry's expected shape, that deviation itself is a signal worth investigating.
The analytical question isn't just "does this business have seasonal revenue?" It's: "Does this business's seasonal curve match what we'd expect for their industry — and if not, why not?" This framework should be a standard part of every MCA underwriting checklist.
Retail and E-Commerce: November–December Peaks
Retail seasonality is the most pronounced of any major sector. According to US Census Bureau monthly retail trade data, October through December regularly represents 35–45% of a retail business's annual deposits. The holiday-driven surge is predictable, consistent, and well-documented.
What follows is equally predictable: a January–February trough as consumer spending resets. This is normal and expected. Underwriters should not penalize retail businesses for low January deposits — that's the industry baseline.
What should raise concern: the absence of a December peak. If a retail business shows flat or declining deposits in November–December, that's not seasonal normality — it suggests either serious revenue problems or potential statement manipulation. Use Census retail trade data as your authoritative benchmark for what peak-season performance should look like.
Construction and Landscaping: Spring–Summer Peaks
Construction and landscaping businesses in most US regions peak from April through September. Deposits during these months may run 2–4x the off-season figures. The November–February trough is structural — projects slow, contracts dry up, and revenue compresses sharply.
A healthy construction or landscaping pattern shows deposits dropping 50–70% from peak during winter months, then recovering steadily through March and April as the busy season begins. The recovery timing matters: a gradual uptick starting in March suggests a pipeline of booked work. An abrupt spike in April without a March ramp may warrant closer examination.
Year-over-year peak consistency is the most important health signal in this industry. If each spring's deposits reach similar levels to the prior spring, the business is stable. If peaks are eroding year over year, that's worth flagging regardless of how strong the current season looks.
Tourism, Hospitality, and Food Service: Variable by Region
Hospitality seasonality varies significantly by location. Beach and summer destination restaurants and hotels peak June–August. Ski resort and winter destination businesses invert this — peaking December–February. Urban year-round restaurants show flatter curves with modest spikes around major holidays.
A healthy hospitality pattern sees off-season deposits maintain 40–60% of peak levels. Below 30% — with no clear recovery trajectory — raises repayment capacity concerns. Bureau of Labor Statistics seasonal employment data provides supporting benchmarks for hospitality employment cycles, which closely track revenue patterns.
Tax Services and Accounting: Q1 Concentration
Tax preparers and accounting firms show perhaps the most concentrated seasonal pattern of any service business. January through April may represent 60–70% of annual deposits. The extended lull from May through November is structurally built into the business model — it's not a sign of distress.
The underwriting implication is clear and important: repayment capacity must be sized against off-season cash flow, not the Q1 peak. An advance approved in March, when deposits are at their highest, may become unserviceable by June. Trough-month repayment capacity is the binding constraint for this industry.
What Healthy Seasonality Looks Like on a Bank Statement
Seasonal revenue variation is normal. The question underwriters need to answer is whether the variation they're seeing represents a well-managed seasonal business or a business in genuine distress. The patterns in the deposit data answer that question — if you know what to look for.
Healthy seasonal businesses show predictability above all else. The same months are strong, the same months are soft, and the business navigates that cycle without crisis. They also show expense discipline: when transaction categorization is applied, costs contract during slow months rather than running at peak-season levels.
Good cash flow analysis from bank statements surfaces these patterns at a glance — and distinguishes them from businesses that are simply hiding structural weakness behind a seasonal label.
The 3 Signals That Indicate a Business Manages Seasonality Well
Three specific signals in 12-month statement data indicate a business is managing its seasonal cycle effectively:
- Average daily balance stays above 15–20% of peak-month balance even in trough months. This shows the business is building cash reserves during busy periods rather than spending everything it earns. A landscaper with $80,000 peak-month average daily balance should show at least $12,000–$16,000 average daily balance in January.
- Off-season months show reduced but not absent deposit activity. Some revenue continuing through the slow season — maintenance contracts, retainer clients, smaller projects — signals business continuity. Full revenue blackouts lasting 3+ weeks are a different story.
- Year-over-year comparison shows stable or growing peaks with consistent recovery timing. If the business's April deposits this year match last April, the seasonal pattern is intact. If recovery is arriving earlier each year, the business is growing. Both are positive signals.
The absence of NSF fees and overdrafts during trough months is an equally important positive signal. Clean trough months indicate the business planned for the off-season — it didn't just hope to survive it.
Seasonal Revenue vs. Structural Decline: The Critical Distinction
This is the most important analytical call an underwriter makes on a seasonal file. Getting it wrong in either direction is costly: approve a structurally declining business by mistaking decline for seasonality, and you're funding a business that can't recover. Decline a healthy seasonal business by misreading normal troughs as distress, and you lose a good borrower.
Seasonal dip: Revenue drops in predictable months, consistent with prior years, and recovers to previous peak levels the following busy season. The arc repeats reliably.
Structural decline: Each year's peak is lower than the prior year's peak. Even in traditionally strong months, deposits fall short of historical levels. The seasonal pattern may still be visible — peaks in summer, troughs in winter — but the whole curve is shifting downward.
To make this call, you need year-over-year data. A single 12-month window gives you the current year's pattern. Two years of data lets you compare this summer's deposits to last summer's. That comparison is the most reliable way to distinguish normal seasonality from a business in decline.
Red Flags: When Seasonality Becomes Instability
Not every revenue dip is seasonal. Some patterns cross the line from normal fluctuation into genuine underwriting risk. Knowing which signals to look for — and what thresholds matter — separates disciplined seasonal underwriting from guesswork.
The risk of true revenue vs. gross revenue confusion is especially acute for seasonal businesses: peak-month gross deposits can make a business look far more capable than its trough-month cash position actually supports.
Variance Thresholds: How Much Month-Over-Month Swing Is Acceptable?
There are no universal hard rules, but there are useful analytical starting points:
| Variance Level | Peak-to-Trough Ratio | Underwriting Implication |
|---|---|---|
| Up to 40–50% month-over-month | 1.5x–2x | Generally acceptable for documented seasonal businesses |
| 50–60% month-over-month | 2x–3x | Normal range for strongly seasonal industries (retail, construction) |
| 60–70% month-over-month | 3x–5x | Warrants additional scrutiny; require industry justification |
| Above 70% month-over-month | Above 5x–6x | Raises significant repayment capacity concerns regardless of industry |
Context matters. A tax preparer showing a 70% revenue drop from April to May is completely normal. A restaurant showing the same drop without a clear regional tourism explanation is a different situation. Apply these thresholds as starting points, not hard cutoffs, and always validate against industry norms.
The Peak Application Problem: Loans Approved at the Worst Time
Seasonal businesses disproportionately apply for financing at or near their revenue peak. The logic makes intuitive sense from the borrower's perspective: they want capital to scale for the busy season, and their bank statements look their best right before or during peak months. But this is exactly when an underwriter's job is most difficult — and most important.
A business applying in June with three months of $80,000 deposits is not showing you a typical month. It's showing you its best months. The underwriter's job is to model repayment against trough-month reality, not peak-month optimism.
A practical approach: calculate average monthly revenue excluding the top 2 and bottom 2 months across the 12-month period. This trimmed figure removes the outliers on both ends and gives a more stable repayment capacity baseline than either a 3-month peak average or a simple annual average.
MCA Stacking in Seasonal Businesses: A Compounding Risk
Seasonal businesses under off-season cash pressure are among the most common MCA stackers. The pattern is predictable: a business takes an advance in spring, remittances run smoothly through peak season, but by November the cash flow can't support the daily payments. The business takes a second advance to cover the gap. Then a third.
By the time the next spring arrives, the business is carrying 2–3 concurrent advances — each with daily ACH remittances — while its deposits are still building back from trough levels. The compounding burden frequently leads to default.
Detecting MCA stacking in 12-month statement data requires looking at ACH debit patterns across all months, not just the most recent period. Multiple regular ACH debits from different lenders appearing in trough-month statements — often in amounts that don't align with any vendor relationship — are the clearest signal of concurrent advance stacking.
How Underwriters Should Calculate Revenue for Seasonal Businesses
Standard average monthly revenue — the sum of 12 months divided by 12 — is the correct baseline for seasonal files. It's far more reliable than a 3-month average, which is heavily influenced by which part of the seasonal cycle the application happens to land in.
But even a simple 12-month average has limitations. Outlier months — an unusually strong December or an anomalous trough caused by a one-time event — can skew the figure in either direction. Two calculation methods address this more precisely.
The Trimmed Mean Method: A Fairer Revenue Calculation
The trimmed mean approach removes the top 2 and bottom 2 months from the 12-month dataset, then averages the remaining 8 months. This produces a seasonality-adjusted revenue figure that reflects typical operating performance rather than outlier peaks or exceptional troughs.
Walk through a concrete example: a landscaper with monthly deposits ranging from $15,000 (January) to $95,000 (June). Simple 12-month average: $52,000. Trimmed mean after removing the two highest months ($95,000 and $88,000) and two lowest months ($15,000 and $18,000): approximately $47,000. That $5,000 difference may seem small, but it has real implications for how much daily remittance this business can sustain year-round.
The trimmed mean is increasingly used by sophisticated MCA lenders and underwriters precisely because it's more resistant to manipulation — inflated deposits in 1–2 months don't move the figure as dramatically as they would in a simple average.
Weighting Trough Months in MCA Repayment Capacity
MCA daily remittance doesn't pause for the off-season. The advance doesn't know it's February. That's what makes repayment capacity sizing so consequential for seasonal businesses — the worst-case cash flow months are the binding constraint, not the average.
A conservative but defensible guideline: daily MCA remittance should not exceed 15–20% of average daily balance in the lowest 3 months of the review period. This ensures that even at trough, the business isn't consuming more than one-fifth of its available cash each day to service the advance.
This is where proper average daily balance calculation across the full 12-month period becomes essential. Average daily balance in trough months — not annual average daily balance — is the relevant figure for this calculation. A business with a $40,000 annual average daily balance may have a January average daily balance of $8,000. That's the number that matters for remittance capacity.
Manual vs. Automated Seasonal Pattern Analysis
Manual 12-month analysis means an underwriter pulls each monthly statement, tabulates deposit totals line by line, builds a spreadsheet, and then tries to visualize a trend from a column of numbers. For a single file, that process takes 2–4 hours. For a team processing dozens of seasonal applications per week, it becomes the primary bottleneck — and the primary source of analytical error.
The hidden cost of manual bank statement review isn't just time. It's the systematic errors that accumulate when humans tabulate hundreds of transactions across 12 separate PDF statements under time pressure.
Where Manual Review Breaks Down on Seasonal Files
Twelve statements from 12 different months arrive as separate PDFs, often with inconsistent statement periods — some covering calendar months, others covering billing cycles that straddle month-end. Manual alignment of these periods into a coherent 12-month view is error-prone and often simply done incorrectly.
The most common errors in manual seasonal analysis include:
- Miscategorized transfers counted as revenue — internal transfers between accounts inflate deposit totals in the months they occur, distorting the seasonal curve
- Duplicate transactions counted twice — statements from overlapping periods create double-counting that inflates peak-month figures specifically
- Missed deposits in multi-page statements — multi-page PDF statements with complex formatting cause reviewers to miss transactions, understating deposits
- Inconsistent NSF tracking — identifying and counting NSF events manually across 12 months is cognitively demanding and frequently incomplete
The result is that two underwriters can analyze the same 12-month file and arrive at meaningfully different average monthly revenue figures — not because of different judgment calls, but because of data collection errors.
What Automated Parsing Surfaces That Manual Review Misses
Automated parsing eliminates the tabulation problem entirely. A 12-month deposit summary is generated in seconds — not hours — with transaction-level categorization applied automatically across all statements simultaneously.
Critically, automated categorization separates operating revenue from loan deposits, internal transfers, and refunds. Manual reviewers frequently count all credits as revenue. Automated tools don't. That distinction alone can change the average monthly revenue figure by 10–15% for businesses that regularly receive transfers or loan disbursements.
Duplicate transaction detection catches the double-counted deposits that inflate peak-month figures in overlapping statement periods — a problem that manual review almost never catches consistently. NSF and overdraft clustering by month is surfaced automatically, without requiring the underwriter to manually scan transaction-by-transaction through 12 months of statements.
See a Full 12-Month Seasonal Analysis in Seconds
See how ClearStaq generates a full 12-month deposit trend analysis in seconds — no manual tabulation required. Book a demo to walk through a seasonal business file with our team.
How ClearStaq Surfaces Seasonal Trends Automatically
ClearStaq parses up to 12 months of bank statements simultaneously and generates month-by-month deposit trend visualizations automatically. Underwriters see the seasonal arc — peaks, troughs, trend direction, year-over-year comparison — without building a single spreadsheet. The platform supports 900+ bank formats, so seasonal analysis works across all statement types without manual reformatting or template switching.
The 27 fraud signals ClearStaq runs include patterns that cluster specifically in seasonal contexts: inflated deposits in the 1–2 months before a loan application, gaps in deposit history during historically active months, and NSF clustering in off-season periods that signals cash management failure rather than normal seasonality.
For MCA brokers and lenders, ClearStaq functions as a complete MCA underwriting platform — combining automated statement parsing, fraud detection, and seasonal trend analysis in a single API-accessible workflow.
Month-by-Month Deposit Trend Visualization
ClearStaq outputs a monthly deposit summary across the full review period automatically. Peak months, trough months, and trend direction are visible at a glance — without manual tabulation or spreadsheet construction. When more than 12 months of statements are submitted, year-over-year comparison is generated automatically, enabling the seasonal-vs.-structural-decline distinction that is otherwise difficult to make from a single year of data.
Normalized average monthly revenue is calculated automatically using the trimmed mean methodology — excluding the top 2 and bottom 2 months — giving underwriters a repayment capacity baseline that reflects typical operating performance rather than seasonal outliers.
Fraud Signals in Seasonal Contexts
Seasonal businesses present specific fraud patterns that generic document review doesn't catch. ClearStaq's detection layer is designed to surface them:
- Pre-application deposit inflation — unusual deposit spikes in the 1–2 months before a loan application are flagged as potential revenue manipulation
- Statement gaps during active months — missing deposit history during a business's historically peak months may indicate altered or substituted statements
- NSF clustering in off-season months — automatically surfaced as a borrower risk indicator without manual transaction review
- Duplicate deposit detection — prevents peak-month revenue from being artificially inflated by overlapping statement periods
- MCA stacking ACH patterns — concurrent advance debits visible in trough-month statements are flagged, identifying the compounding risk before approval rather than after
The same SBA loan underwriting analysis framework applies here — 12-month seasonal pattern review is equally critical in traditional lending contexts, not just MCA.
Frequently Asked Questions
What does 12 months of bank statements show a lender?
Twelve months of bank statements reveal a business's complete seasonal revenue cycle, including peak deposit months, trough periods, average daily balance trajectory, NSF clustering, and whether the business recovers predictably after slow seasons. This view allows lenders to calculate normalized average monthly revenue and assess repayment capacity against worst-case cash flow months — not just the best ones.
How do lenders account for seasonal revenue when reviewing bank statements?
Lenders calculate a normalized average monthly revenue figure across the full 12-month period, often using a trimmed mean that excludes the highest and lowest months to remove outliers. Repayment capacity for products like MCAs is then sized against trough-month average daily balance rather than peak-month deposits, ensuring the borrower can service the debt year-round.
What is considered a normal revenue fluctuation on bank statements?
For documented seasonal businesses, month-over-month revenue variance of up to 40–50% is generally considered acceptable, with peak months typically running 2x–3x trough months. Variance above 60–70% without a clear industry justification, or a peak-to-trough ratio above 5x–6x, warrants additional scrutiny from underwriters.
Can a seasonal business qualify for an MCA or business loan?
Yes — seasonal businesses regularly qualify for MCAs and business loans, provided lenders evaluate the full 12-month revenue picture rather than a peak-period snapshot. Approval is typically sized to trough-month repayment capacity, and the strongest seasonal applicants show predictable recovery timing, stable average daily balances during off-seasons, and no NSF clustering in slow months.
How do you distinguish seasonal revenue dips from structural decline on bank statements?
Seasonal dips are predictable, recur in the same calendar months each year, and are followed by recovery to prior peak levels the following busy season. Structural decline shows as year-over-year erosion in peak-month deposits — each summer or holiday season is weaker than the last — even when the seasonal pattern itself remains visible in the data.
Stop Sizing Advances Against Peak-Month Snapshots
Stop sizing MCA advances against peak-month snapshots. ClearStaq's automated 12-month analysis surfaces seasonal patterns, normalizes revenue, and flags trough-month risk signals before you approve — not after.
Frequently Asked Questions
What does 12 months of bank statements show a lender?
Twelve months of bank statements reveal a business's complete seasonal revenue cycle, including peak deposit months, trough periods, average daily balance trajectory, NSF clustering, and whether the business recovers predictably after slow seasons. This view allows lenders to calculate normalized average monthly revenue and assess repayment capacity against worst-case cash flow months, not just the best ones.
How do lenders account for seasonal revenue when reviewing bank statements?
Lenders calculate a normalized average monthly revenue figure across the full 12-month period, often using a trimmed mean that excludes the highest and lowest months to remove outliers. Repayment capacity for products like MCAs is then sized against trough-month average daily balance rather than peak-month deposits, ensuring the borrower can service the debt year-round.
What is considered a normal revenue fluctuation on bank statements?
For documented seasonal businesses, month-over-month revenue variance of up to 40–50% is generally considered acceptable, with peak months typically running 2x–3x trough months. Variance above 60–70% without a clear industry justification, or a peak-to-trough ratio above 5x–6x, warrants additional scrutiny from underwriters.
Can a seasonal business qualify for an MCA or business loan?
Yes — seasonal businesses regularly qualify for MCAs and business loans, provided lenders evaluate the full 12-month revenue picture rather than a peak-period snapshot. Approval is typically sized to trough-month repayment capacity, and the strongest seasonal applicants show predictable recovery timing, stable average daily balances during off-seasons, and no NSF clustering in slow months.
How do you distinguish seasonal revenue dips from structural decline on bank statements?
Seasonal dips are predictable, recur in the same calendar months each year, and are followed by recovery to prior peak levels the following busy season. Structural decline shows as year-over-year erosion in peak-month deposits — each summer or holiday season is weaker than the last — even when the seasonal pattern itself remains visible in the data.
ClearStaq Team
Product Team
The ClearStaq team builds AI-powered tools for bank statement parsing, fraud detection, and income verification.