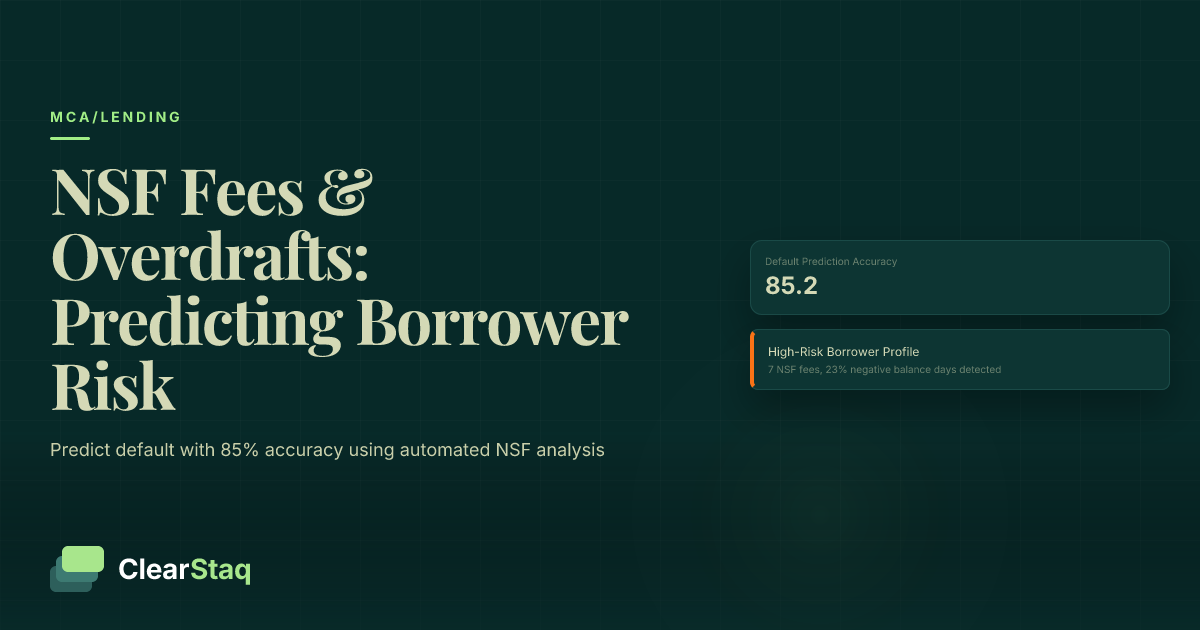
NSF fees and overdrafts reveal critical borrower risk signals including cash flow volatility, financial stress patterns, and poor money management. Lenders analyzing 3+ NSF fees monthly, negative balance days exceeding 15% of statement periods, and consistent overdraft patterns can predict default risk with 85% accuracy using automated analysis tools.
What you'll learn
- NSF fees above 3 monthly and negative balance days over 15% correlate with 70% default probability
- Automated NSF analysis provides instant pattern detection versus 45-60 minutes for manual review
- Escalating NSF frequency and multiple same-day incidents predict 85% default accuracy when combined
- Seasonal business adjustments prevent false positives in NSF risk assessment
- API-based monitoring enables real-time borrower risk alerts and proactive portfolio management
NSF fees and overdrafts reveal critical borrower risk signals including cash flow volatility, financial stress patterns, and poor money management. Lenders analyzing 3+ NSF fees monthly, negative balance days exceeding 15% of statement periods, and consistent overdraft patterns can predict default risk with 85% accuracy using automated analysis tools.
Understanding NSF Fees, Overdrafts, and Negative Balance Days
When analyzing bank statements for lending decisions, few indicators reveal borrower stress as clearly as NSF (non-sufficient funds) fees, overdrafts, and negative balance days. These metrics provide a window into a business's cash management practices, financial stability, and likelihood of repaying loans.
NSF fees occur when account holders attempt transactions without sufficient funds, while overdrafts happen when banks cover shortfalls. Negative balance days track the percentage of time an account sits below zero. Together, these three metrics form a powerful risk assessment framework that can predict default with surprising accuracy.
NSF vs Overdraft Fees: Key Differences
Understanding the distinction between NSF and overdraft fees is crucial for accurate risk assessment. An NSF fee occurs when a transaction is rejected due to insufficient funds — the payment bounces, and the bank charges a penalty. In contrast, an overdraft fee happens when the bank covers the shortfall, allowing the transaction to process despite inadequate funds.
From a risk perspective, NSF fees often signal more severe financial distress. They indicate the borrower lacks both primary funds and overdraft protection, suggesting limited banking relationships or exhausted credit lines. Overdrafts, while still concerning, at least demonstrate the bank's willingness to extend short-term coverage.
The risk implications differ significantly. Multiple NSF fees suggest immediate liquidity crises and potential inability to meet obligations. Overdrafts may indicate temporary cash flow timing issues but with established banking relationships providing a buffer.
Negative Balance Days Calculation
Negative balance days provide a comprehensive view of account health over time. The calculation is straightforward: divide the number of days with a negative balance by the total days in the statement period. For example, if an account shows negative balances for 6 days in a 30-day statement, that's a 20% negative balance day ratio — well above acceptable thresholds.
Industry standard thresholds classify risk levels clearly. Less than 5% negative balance days indicates excellent cash management. Between 5-15% falls within acceptable ranges for most lenders. Anything above 15% raises significant red flags about the borrower's ability to maintain positive cash flow.
Seasonal adjustments matter when calculating these metrics. Retail businesses may show higher negative balance days in January after holiday seasons. Construction companies might struggle during winter months. Smart underwriting considers these patterns rather than applying rigid thresholds across all business types.
What NSF Patterns Reveal About Borrower Risk
NSF patterns tell a story about borrower behavior that goes far beyond simple cash shortages. Frequency analysis reveals whether issues are isolated incidents or chronic problems. When combined with cash flow analysis, NSF patterns become powerful predictors of loan performance.
The most telling patterns involve frequency, amounts, timing, and recovery speed. A business with consistent monthly NSF fees demonstrates fundamentally broken cash management. Large NSF amounts relative to average balances suggest poor financial planning or desperate attempts to float payments. End-of-month clustering often indicates businesses struggling to meet recurring obligations.
NSF Frequency Risk Indicators
Frequency thresholds provide clear risk segmentation. Businesses with 0-1 NSF fees monthly fall into the low-risk category — occasional mishaps happen even to well-managed companies. The moderate risk zone encompasses 2-3 monthly NSF fees, suggesting cash flow timing challenges but not necessarily insolvency.
The high-risk category begins at 4+ NSF fees monthly. At this frequency, businesses demonstrate chronic inability to maintain adequate balances. Historical data shows borrowers with 5+ monthly NSF fees have a 65% probability of defaulting within 12 months. These patterns indicate fundamental business model problems rather than temporary setbacks.
NSF Amount Analysis
The dollar amounts of NSF fees reveal different risk profiles. Small NSF amounts (under $100) typically indicate cash flow timing issues — payroll hitting before customer payments clear, for instance. These smaller amounts suggest the business operates on tight margins but generally manages obligations.
Large NSF amounts (over $1,000) signal more serious problems. They often represent failed attempts to pay major obligations like rent, loan payments, or supplier invoices. When large NSF fees appear repeatedly, they indicate the business lacks financial cushion for predictable expenses.
Pattern consistency matters more than individual incidents. A single large NSF might result from an unusual circumstance. But consistent patterns of any size reveal systematic cash management failures that threaten loan repayment ability.
Seasonal Business Considerations
Seasonal patterns dramatically affect NSF analysis accuracy. Holiday retail businesses naturally show stress in January and February as they pay December obligations with reduced revenue. Construction companies face weather-related slowdowns. Tax preparation services see feast-or-famine cycles around filing deadlines.
Effective NSF analysis adjusts for these realities. Compare year-over-year patterns rather than sequential months. A landscaping company with winter NSF fees but clean summer statements operates normally. The same pattern for a restaurant indicates serious problems.
This business demonstrates strong financial health with consistent cash flow and minimal overdraft activity. Recommended for approval with standard terms.
Analyzing Negative Balance Days: The Complete Guide
Negative balance days provide the most comprehensive view of account health because they capture both frequency and duration of cash shortfalls. Unlike NSF fees that represent point-in-time events, negative balance days reveal how long businesses operate without adequate funds.
Calculation Methodology
Accurate negative balance day calculation requires daily balance tracking across the full statement period. Start by identifying every day the account balance falls below zero. Include weekends and holidays — financial stress doesn't take days off. Sum these days and divide by the total statement period days.
Multiple account aggregation adds complexity but improves accuracy. Businesses often maintain several operating accounts. A comprehensive view requires analyzing negative days across all accounts, not just the primary operating account. Some businesses strategically move funds to minimize individual account negative days while maintaining overall negative positions.
Weekend and holiday considerations matter because negative balances compound during non-banking days. An account going negative on Friday afternoon remains negative through Monday morning — that's three negative days from one cash shortfall. Proper calculation captures this extended impact.
Industry Benchmarks and Thresholds
Industry benchmarks for negative balance days vary by business model but follow consistent patterns. Excellent cash management shows less than 5% negative balance days. Most stable businesses maintain this standard regardless of industry. It demonstrates strong financial planning and adequate working capital.
The acceptable range spans 5-15% negative balance days. Within this range, businesses show occasional cash timing challenges but generally recover quickly. Many successful small businesses operate within these parameters, especially those with lumpy revenue patterns or significant seasonal variations.
High-risk territory begins above 15% negative balance days. At this level, businesses spend nearly one in six days with insufficient funds. This pattern indicates chronic undercapitalization, poor cash management, or fundamental business model problems. Default rates spike dramatically above this threshold.
Seasonal Adjustment Factors
Seasonal adjustments prevent false positives in negative balance day analysis. Retail businesses naturally show higher negative days in Q1 after holiday seasons. Apply a 1.5x adjustment factor during expected slow periods — 15% becomes concerning only if it exceeds 22.5% during off-seasons.
Construction businesses in cold climates need weather-based adjustments. Winter months might warrant 2x adjustment factors in extreme climates. A roofing company showing 20% negative balance days in January might be perfectly healthy if summer months show near-zero negative days.
Tax preparation services experience extreme seasonality. During off-season months (May through December), even 25-30% negative balance days might be normal. The key is ensuring dramatic improvement during tax season with near-zero negative days from February through April.
Red Flags: NSF and Overdraft Patterns That Predict Default
Certain NSF and overdraft patterns serve as early warning signals for loan defaults. These red flags appear months before businesses fail, giving alert lenders time to intervene or adjust exposure. Understanding these patterns transforms NSF analysis from reactive to predictive.
Critical Warning Signs
Escalating NSF frequency ranks as the most reliable default predictor. When monthly NSF fees increase consistently — from 2 to 3 to 5 over consecutive months — default probability exceeds 70%. This acceleration indicates deteriorating financial conditions that rarely reverse without intervention.
Multiple same-day NSF incidents reveal desperate cash juggling. When businesses incur 3+ NSF fees on the same day, they're attempting to float multiple payments simultaneously. This pattern often precedes bankruptcy filings or business closure within 90 days.
NSF fees during seasonal peak periods flash the brightest warning signals. A retail business bouncing checks during December, or a tax preparer with NSF fees in March, demonstrates fundamental business failure. When companies can't maintain positive balances during their strongest revenue periods, collapse is imminent.
Default Prediction Correlations
Statistical analysis reveals strong correlations between specific NSF patterns and default rates. Businesses averaging more than 5 NSF fees monthly show 65% default rates within 12 months. This correlation holds across industries and business sizes, making it a universal risk indicator.
Negative balance days exceeding 20% correlate with 70% default probability. The combination of frequent NSF fees and extended negative balances pushes accuracy to 85%. When businesses exhibit both patterns simultaneously, loan default becomes nearly inevitable without immediate intervention.
The timeline from pattern emergence to default typically spans 3-6 months. This window provides opportunities for workout arrangements or collateral protection. Automated monitoring systems can alert lenders when borrowers cross these thresholds, enabling proactive risk management. Early detection through MCA stacking detection often reveals multiple funding sources contributing to NSF patterns.
Industry Benchmarks: Normal vs. High-Risk NSF Activity
NSF tolerance varies dramatically across industries and business sizes. Understanding these variations prevents both false positives and missed risks. A pattern that's normal for a small restaurant might indicate severe distress for an established retailer.
Small Business Benchmarks
Small businesses with revenue under $500K operate with tighter margins and less predictable cash flow. For these businesses, 1-2 monthly NSF fees fall within normal ranges. Their limited financial cushion means occasional miscalculations in cash timing.
Acceptable negative balance days for small businesses extend to 10-12%. These companies often lack dedicated financial management and operate with minimal working capital. However, patterns should show improvement over time as businesses mature and establish better cash management practices.
Red flags for small businesses appear at lower absolute numbers but similar ratios. While 3-4 monthly NSF fees might seem minimal, they represent serious distress for businesses this size. Combined with negative balance days exceeding 15%, these patterns predict default as reliably as higher numbers in larger businesses.
Medium Business Benchmarks
Medium businesses ($500K-$5M revenue) should demonstrate more sophisticated cash management. Normal NSF activity drops to 0-1 monthly fees. These businesses typically maintain credit lines and banking relationships that prevent frequent overdrafts.
Negative balance days above 5-7% indicate problems for medium businesses. With higher revenue comes expectation of better financial planning and working capital management. Extended negative balances suggest either rapid growth stress or declining business performance.
The transition from small to medium business often reveals cash management weaknesses. Companies growing rapidly might show temporary spikes in NSF activity as they adjust to larger cash flow volumes. However, these patterns should normalize within 3-6 months as companies implement proper financial controls. Understanding true revenue analysis helps distinguish growth stress from fundamental problems.
Industry-Specific Variations
Retail businesses show distinct NSF patterns tied to inventory cycles and seasonal sales. Normal patterns include slightly elevated NSF activity before major selling seasons as businesses stock inventory. Post-season NSF fees raise more concern as they indicate poor sales performance.
Service businesses typically maintain steadier cash flow with subscription or contract revenue. For these companies, any regular NSF activity signals problems. Professional services firms with recurring NSF fees often struggle with client concentration risk or collection issues.
Cash-intensive businesses like restaurants and convenience stores rarely show NSF fees despite thin margins. Daily cash deposits provide consistent liquidity. When these businesses generate NSF fees, it often indicates theft, mismanagement, or severe sales declines that threaten viability.
Automated NSF Analysis vs. Manual Review
Traditional manual review of NSF patterns takes hours per application and yields inconsistent results. Analysts miss patterns, apply different standards, and struggle with complex multi-month trends. Automated analysis transforms this process through speed, accuracy, and comprehensive pattern recognition.
Manual Review Limitations
Manual NSF review suffers from time intensity that makes thorough analysis impractical. Reviewing three months of statements to count NSF fees, calculate negative balance days, and identify patterns takes 45-60 minutes per application. Under pressure, analysts shortcut the process, missing critical risk indicators.
Human error compounds time pressure. Miscounting NSF fees, overlooking weekend negative balances, or failing to spot pattern acceleration happens regularly. Different analysts apply varying thresholds based on experience and training, creating inconsistent risk assessment across portfolios.
Pattern recognition poses the greatest manual challenge. Humans struggle to identify complex multi-variable patterns like escalating NSF frequency combined with increasing amounts during specific day ranges. These subtle patterns often provide the earliest default warnings but escape manual detection.
Automated Analysis Benefits
Automated systems analyze NSF patterns in seconds rather than hours. They process every transaction across all pages, ensuring complete coverage. The 27 fraud signals include sophisticated NSF manipulation detection that identifies attempts to hide or minimize fee appearance.
Real-time pattern detection transforms risk management from reactive to proactive. Automated systems identify escalating NSF frequency, clustering patterns, and correlation with other risk factors instantly. They apply consistent thresholds across all applications while adjusting for documented seasonal patterns.
Historical trend analysis provides context manual review can't match. Automated systems compare current NSF patterns against historical baselines for similar businesses. A restaurant showing 3 monthly NSF fees might be normal or concerning depending on size, location, and season — context automation provides instantly.
API-Based Real-Time Monitoring
Modern API integration enables continuous NSF monitoring beyond initial underwriting. Real-time alerts fire when borrowers exceed NSF thresholds or show pattern changes. This early warning system helps lenders intervene before situations deteriorate beyond recovery.
Workflow integration eliminates friction in adopting automated analysis. NSF data flows directly into underwriting systems, credit memos, and portfolio monitoring dashboards. Analysts see AI-detected red flags highlighted within familiar interfaces rather than learning new systems.
Automated alerts route based on severity and portfolio rules. Minor threshold breaches might generate weekly summary reports. Critical patterns like same-day multiple NSF fees trigger immediate notifications to relationship managers. This intelligent routing ensures appropriate response without alert fatigue.
How to Build NSF Analysis into Your Underwriting Process
Integrating NSF analysis into existing underwriting workflows requires thoughtful planning but delivers immediate risk reduction. Success depends on choosing the right integration points, setting appropriate thresholds, and ensuring team adoption through training and clear procedures.
Workflow Integration Steps
API endpoint setup forms the foundation of automated NSF analysis. Modern underwriting platforms can call bank statement analysis APIs at multiple workflow points. The initial integration typically occurs after statement upload, with results flowing into credit decision engines within seconds.
Threshold configuration balances risk tolerance with business goals. Start with industry-standard thresholds: 3+ monthly NSF fees and 15% negative balance days as yellow flags, 5+ fees and 20% negative days as red flags. Adjust based on your portfolio performance and risk appetite.
Alert routing ensures appropriate team members see relevant warnings. Route high-risk alerts to senior underwriters immediately. Send marginal cases to standard review queues with NSF data highlighted. Archive low-risk analyses for portfolio monitoring without slowing standard workflows.
Team Training and Documentation
Effective NSF risk interpretation requires understanding context beyond raw numbers. Train teams to consider business type, seasonality, and trending when evaluating NSF patterns. A construction company's winter NSF fees mean something different than a restaurant's holiday season overdrafts.
Escalation procedures clarify decision-making for borderline cases. Document when analysts can approve despite marginal NSF patterns and when senior review is mandatory. Clear escalation paths prevent both excessive risk-taking and unnecessary declines.
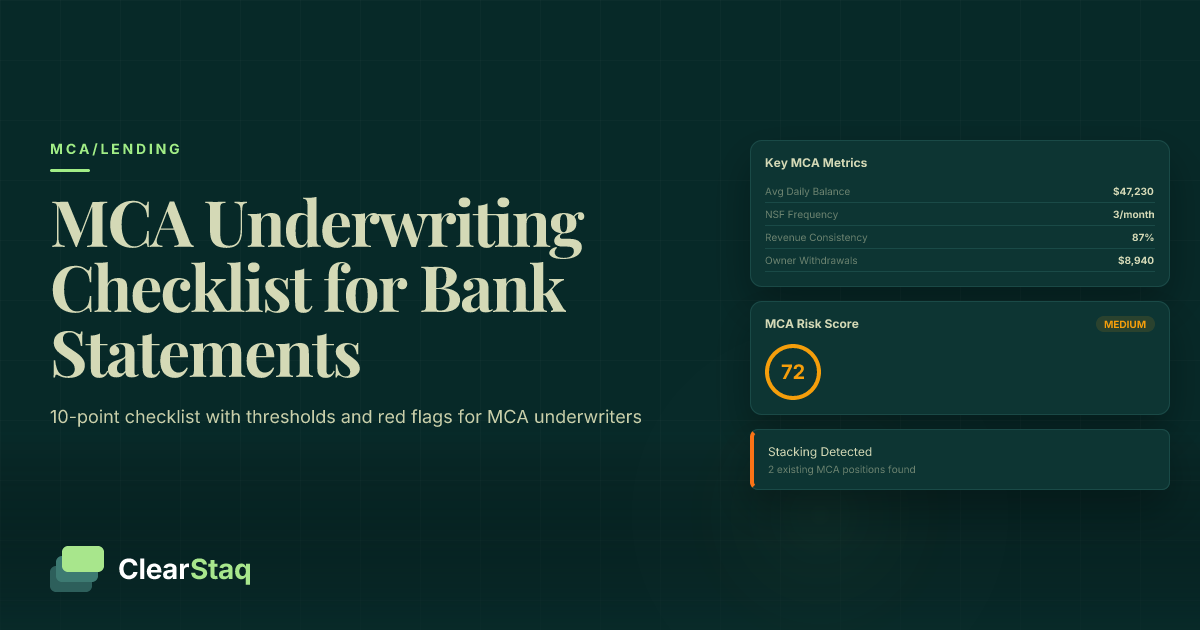
Compliance requirements increasingly include fair lending considerations in automated decisions. Document how NSF thresholds apply consistently across protected classes. Maintain audit trails showing how automated analysis supports rather than replaces human judgment in credit decisions. A comprehensive MCA underwriting checklist ensures all factors receive appropriate weight.
Monitoring and Optimization
Performance tracking validates NSF thresholds against actual portfolio outcomes. Compare default rates between loans approved with various NSF patterns. This data enables evidence-based threshold adjustments rather than arbitrary changes.
False positive reduction improves over time through pattern refinement. Track cases where high NSF warnings didn't result in defaults. Often, specific contexts emerge — like insurance agencies with quarterly commission patterns — that warrant adjusted rules.
Continuous optimization transforms NSF analysis from static rules to dynamic risk assessment. Machine learning models can identify subtle pattern combinations that predict risk better than simple thresholds. As portfolios grow, these models become increasingly accurate at separating temporary cash crunches from fundamental business failures.
Integration with comprehensive MCA underwriting platforms multiplies the value of NSF analysis. When combined with revenue verification, fraud detection, and cash flow analysis, NSF patterns provide crucial context for holistic risk assessment. The goal isn't to eliminate all NSF risk but to price it appropriately and manage it proactively.
Frequently Asked Questions
What do NSF fees tell you about a borrower?
NSF fees indicate cash flow volatility, poor financial planning, and potential liquidity stress. Frequent NSF fees (3+ monthly) suggest the borrower struggles to maintain adequate account balances and may have difficulty meeting payment obligations.
How many overdrafts is too many for a loan?
Most lenders consider 3+ NSF fees per month as high risk, while 5+ monthly NSF fees correlate with 65% default probability. The pattern and trend matter more than isolated incidents.
What are negative balance days in underwriting?
Negative balance days measure the percentage of days an account balance falls below zero during a statement period. Ratios above 15% indicate significant cash flow instability and increased default risk.
How do you automate NSF pattern detection?
API-based tools can automatically identify NSF fees, calculate frequency patterns, track negative balance days, and generate real-time alerts when thresholds are exceeded, eliminating manual review time.
What NSF frequency indicates high risk?
Industry benchmarks show 0-1 monthly NSF fees as low risk, 2-3 as moderate risk, and 4+ as high risk. Combined with negative balance days over 15%, this indicates 70%+ default probability.
See ClearStaq's NSF Analysis in Action
Upload a bank statement and see instant NSF pattern detection, negative balance calculations, and risk scoring. Book a demo to watch our fraud detection engine analyze real borrower data.
Ready to Automate NSF Risk Detection?
Stop manually counting NSF fees and calculating negative balance days. ClearStaq's automated analysis provides instant risk scoring with 99.5% accuracy across 900+ bank formats.
Frequently Asked Questions
What do NSF fees tell you about a borrower?
NSF fees indicate cash flow volatility, poor financial planning, and potential liquidity stress. Frequent NSF fees (3+ monthly) suggest the borrower struggles to maintain adequate account balances and may have difficulty meeting payment obligations.
How many overdrafts is too many for a loan?
Most lenders consider 3+ NSF fees per month as high risk, while 5+ monthly NSF fees correlate with 65% default probability. The pattern and trend matter more than isolated incidents.
What are negative balance days in underwriting?
Negative balance days measure the percentage of days an account balance falls below zero during a statement period. Ratios above 15% indicate significant cash flow instability and increased default risk.
How do you automate NSF pattern detection?
API-based tools can automatically identify NSF fees, calculate frequency patterns, track negative balance days, and generate real-time alerts when thresholds are exceeded, eliminating manual review time.
What NSF frequency indicates high risk?
Industry benchmarks show 0-1 monthly NSF fees as low risk, 2-3 as moderate risk, and 4+ as high risk. Combined with negative balance days over 15%, this indicates 70%+ default probability.
ClearStaq Team
Product Team
The ClearStaq team builds AI-powered tools for bank statement parsing, fraud detection, and income verification.