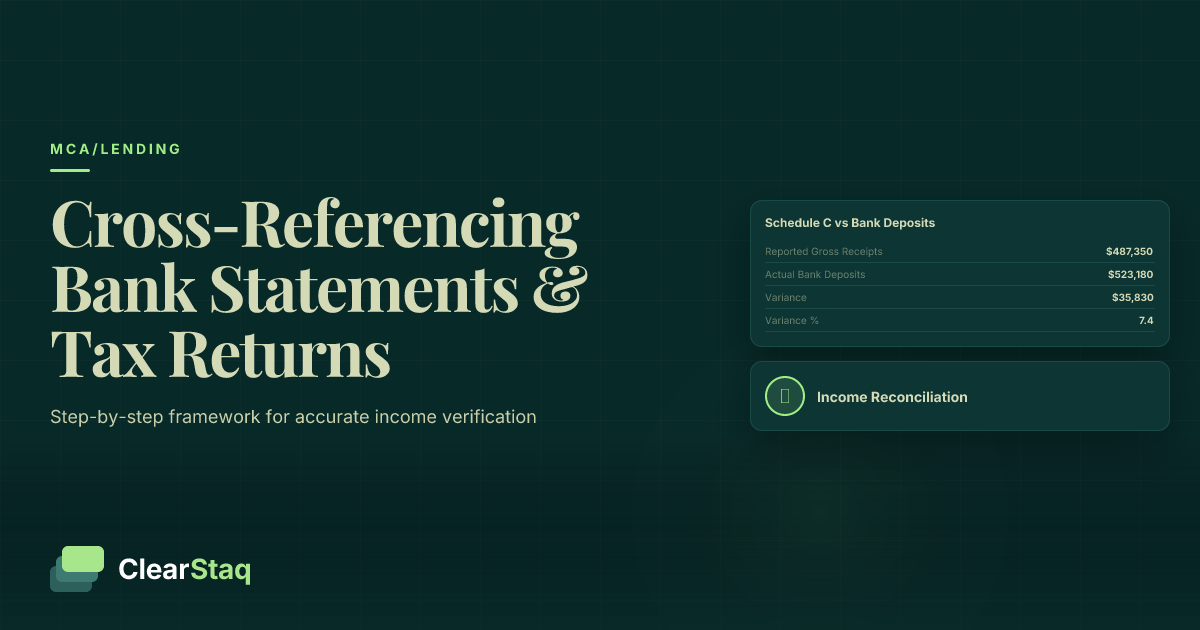
Cross-referencing bank statements with tax returns involves systematically comparing reported income on Schedule C against actual bank deposits, reconciling business expenses with transaction patterns, and identifying discrepancies that may indicate fraud or income misrepresentation. This verification process is essential for MCA underwriting accuracy.
What you'll learn
- Systematic cross-referencing reduces MCA default rates from 18-25% to 8-12% through better income verification
- Five-step framework covers document alignment, income comparison, transaction analysis, expense matching, and fraud detection
- Acceptable variance ranges are 5-15% depending on business type, with seasonal businesses requiring special consideration
- Automated cross-referencing tools achieve 95%+ accuracy while reducing analysis time from hours to minutes
- Red flags include income without corresponding deposits, round-number adjustments, and expenses without matching withdrawals
Cross-referencing bank statements with tax returns involves systematically comparing reported income on Schedule C against actual bank deposits, reconciling business expenses with transaction patterns, and identifying discrepancies that may indicate fraud or income misrepresentation. This verification process is essential for MCA underwriting accuracy.
Why Cross-Referencing Bank Statements and Tax Returns Matters
Income verification forms the foundation of every MCA underwriting decision. While tax returns show what borrowers reported to the IRS, bank statements reveal actual cash flow patterns. This critical distinction can make or break portfolio performance.
The gap between reported income and actual deposits often tells the most important story in underwriting. Tax returns may show inflated revenue to qualify for larger advances, while bank statements reveal the true financial health of the business. Effective bank statement income verification catches these discrepancies before they become costly defaults.
MCA lenders who skip comprehensive cross-referencing face significantly higher default rates. Industry data shows that loans with unverified income claims default at rates 40-60% higher than properly verified applications. The cost of thorough document analysis pales compared to the losses from fraudulent or overstated income claims.
The Cost of Poor Income Verification
Default statistics paint a clear picture of verification's importance. MCA portfolios with robust cross-referencing processes report default rates between 8-12%, while those relying solely on stated income see defaults ranging from 18-25%.
Loss ratios directly correlate with verification thoroughness. Funders who implement systematic cross-referencing reduce charge-offs by an average of 35% within the first year. The math is simple: investing in proper verification saves multiples in avoided losses.
Portfolio risk concentrates in applications with significant document discrepancies. Businesses showing variance greater than 20% between reported and actual income account for nearly 70% of early payment defaults in the MCA space.
Legal and Regulatory Requirements
UDAAP compliance requires lenders to verify borrower information reasonably. Accepting tax returns at face value without bank statement corroboration can constitute unfair practices, especially when obvious discrepancies exist.
Documentation standards mandate maintaining audit trails for income verification decisions. Cross-referencing creates the paper trail necessary to defend underwriting choices during regulatory examinations or investor due diligence.
The MCA Underwriter's Cross-Reference Framework
Systematic cross-referencing follows a five-step framework that ensures comprehensive analysis while maintaining efficiency. This methodology works across business types and catches both obvious and subtle discrepancies.
Timeline considerations are critical for accurate comparison. Tax returns reflect annual data, while bank statements typically cover 3-6 months. Understanding how to annualize bank statement data and match it to appropriate tax return periods prevents false discrepancy flags.
Business type considerations affect every aspect of the process. Cash-heavy businesses like restaurants require different analysis than B2B service companies. Understanding industry patterns helps distinguish legitimate variations from concerning discrepancies.
Step 1: Document Preparation and Timeline Alignment
Tax return year matching ensures apples-to-apples comparison. Use the most recent filed return, typically 2023 for current applications. Verify the business operated under similar conditions during the tax return period.
Bank statement period selection should cover at least 6 months of recent activity. For seasonal businesses, ensure the period captures representative business cycles rather than just off-season or peak-season activity.
Business calendar considerations matter for year-end comparisons. Companies with fiscal years ending in months other than December require careful attention to timing differences between tax reporting and bank statement periods.
Step 2: High-Level Income Comparison
Schedule C gross receipts vs total deposits provides the initial variance calculation. Annualize bank statement deposits to match the tax return's annual figures. For example, 6 months of bank data should be multiplied by 2 for annual comparison.
Initial variance calculation establishes the baseline discrepancy. Calculate the percentage difference: (Bank Statement Annual Income - Tax Return Gross Receipts) / Tax Return Gross Receipts × 100.
Acceptable threshold ranges vary by business type. Service businesses typically show 5-10% variance, while cash-heavy businesses may legitimately vary by 15-20%. Variances exceeding these ranges require detailed investigation.
Step 3: Detailed Transaction Analysis
Line-by-line matching involves categorizing every significant deposit and withdrawal to understand the business's financial operations. This granular analysis reveals patterns that high-level comparisons miss.
Source identification helps distinguish business revenue from other deposits like loan proceeds, personal transfers, or returns/refunds. Each deposit source must be verified and categorized appropriately.
Pattern recognition identifies suspicious activities like kiting, artificial deposit inflation, or timing manipulations designed to improve apparent cash flow during the bank statement period.
This business demonstrates strong financial health with consistent cash flow and minimal overdraft activity. Recommended for approval with standard terms.
Revenue Reconciliation: Matching Income Sources
Schedule C Line 1 (Gross receipts) represents the business's total reported income before deductions. This figure should correlate closely with business deposits shown in bank statements, accounting for timing differences and multiple revenue streams.
Identifying business vs personal deposits requires careful analysis of deposit sources, amounts, and patterns. Business revenue typically shows consistent patterns related to the business model, while personal deposits appear irregular and from different sources.
Handling multiple revenue streams becomes complex when businesses operate from several accounts or have diverse income sources. Each stream must be identified and verified independently before combining for total income calculation.
Cash business considerations present unique challenges in cross-referencing. Restaurants, retail stores, and service businesses handling significant cash may legitimately show differences between deposits and reported income if cash is deposited less frequently or in different periods.
Understanding Schedule C Revenue Categories
Line-by-line breakdown of Schedule C reveals different income types. Line 1 shows gross receipts, while other lines may show returns/allowances or other income sources. Each requires different bank statement verification approaches.
Common business types follow predictable patterns. Professional services show regular client payments, retail businesses show daily deposit patterns, and contractors show project-based payment schedules.
Industry-specific considerations affect revenue recognition. Businesses with Net 30 payment terms show timing lags between service delivery and cash receipt, while cash businesses show immediate deposit patterns.
Bank Deposit Analysis Methodology
Deposit categorization separates business revenue from other deposit types. Business deposits typically show merchant processing patterns, check deposits from business customers, or cash deposits following business operation schedules.
Source identification traces each deposit to its origin. ACH deposits often show business customer names, while cash deposits should align with business operating patterns and true revenue vs gross revenue considerations.
Transfer vs revenue deposits must be distinguished carefully. Transfers between accounts, loan proceeds, or personal deposits can inflate apparent business income if not properly categorized.
Reconciling Timing Differences
Accrual vs cash accounting creates legitimate discrepancies between tax returns and bank statements. Businesses using accrual accounting may report income before cash receipt, while cash accounting shows income only when received.
Year-end cutoffs often create timing variances. December sales deposited in January appear on bank statements but not in the previous year's tax return, creating apparent discrepancies that require explanation.
Payment processing delays affect businesses using credit card processors or ACH systems. Revenue earned in one period may appear as deposits in the following period due to processing time lags.
Expense Analysis and Business Spending Patterns
Matching Schedule C deductions to bank statement withdrawals provides insight into business operations and helps verify the legitimacy of claimed expenses. This analysis often reveals more fraud indicators than income review alone.
Identifying legitimate business expenses vs personal spending requires understanding normal business operations. Expenses should align with the business type, show regular patterns for ongoing costs, and correlate with revenue levels.
Common expense categories leave distinct signatures in bank statements. Rent payments appear monthly, payroll shows regular patterns, and supply purchases align with business activity levels. Understanding these patterns helps verify expense legitimacy.
Schedule C Expense Categories
Major expense lines on Schedule C include advertising, car/truck expenses, office expenses, rent, supplies, travel, and wages. Each category has typical bank statement signatures that help verify legitimacy.
Industry-specific deductions vary significantly between business types. Contractors show materials and equipment expenses, while professional services emphasize office costs and professional development. Understanding industry norms helps identify unusual patterns.
Common manipulation tactics include inflating expenses to reduce tax liability while maintaining higher cash flow. This creates artificial profitability that bank statements may not support when considering the reported expense levels.
Bank Statement Expense Tracking
Transaction categorization groups withdrawals by expense type to match Schedule C categories. Automated expense categorization tools can speed this process while improving accuracy.
Vendor identification helps verify legitimate business expenses. Payments to known suppliers, landlords, or service providers support claimed deductions, while unidentifiable cash withdrawals raise questions about expense legitimacy.
Spending pattern analysis reveals whether expenses align with business operations. Seasonal businesses should show variable expenses, while service businesses typically have more consistent overhead costs.
Expense-to-Revenue Ratios
Industry benchmarks help identify unusual expense patterns. Most businesses show expense ratios within predictable ranges for their industry type, with significant deviations requiring explanation.
Unusual ratios often indicate manipulation or misreporting. Expense ratios significantly below industry norms may suggest unreported revenue, while ratios above norms may indicate inflated expenses.
Profitability indicators derived from expense analysis help assess business viability. Businesses showing healthy tax return profits but minimal bank account growth may have credibility issues in their financial reporting.
Common Discrepancies and How to Interpret Them
Acceptable variance ranges typically fall between 5-15% depending on business type and timing factors. Service businesses usually show tighter correlations, while cash-heavy businesses may legitimately vary more significantly.
Timing differences vs actual discrepancies require careful analysis to avoid false positives. Year-end timing issues, payment processing delays, and seasonal patterns can create apparent discrepancies that have legitimate explanations.
Business vs personal account mixing creates common discrepancies when borrowers operate through multiple accounts or mix business and personal finances. This requires additional documentation to verify income accuracy.
Legitimate Discrepancy Explanations
Timing differences account for many apparent discrepancies. Fourth-quarter sales deposited in the following January, year-end expense payments, and holiday payment delays can create temporary variances.
Multiple accounts complicate income tracking when businesses operate through several bank accounts. Total income may be accurate when all accounts are combined, even if individual account analysis shows discrepancies.
Payment processing creates delays between transaction dates and deposit dates. Credit card processing, ACH payments, and check clearing times can shift income between periods without indicating fraud.
Loan proceeds from other sources can inflate bank deposits beyond business revenue. Equipment loans, SBA funding, or personal loans deposited to business accounts create apparent income that isn't operational revenue.
Concerning Discrepancy Patterns
Consistent under-reporting suggests systematic income hiding rather than legitimate timing differences. This pattern often indicates tax evasion or unreported cash income that raises both tax and lending concerns.
Round number adjustments in tax returns without corresponding bank statement evidence suggest potential manipulation. Businesses rarely have perfectly round income or expense figures without deliberate adjustment.
Missing deposit sources for claimed income create red flags when tax returns show revenue that cannot be traced to specific bank deposits. Every dollar of reported income should have identifiable deposit sources.
Documentation and Follow-Up Requirements
Borrower explanations should be documented in writing when discrepancies exceed acceptable thresholds. These explanations become part of the underwriting file and may be required for investor or regulatory review.
Additional documentation may include additional bank statements, merchant processing reports, or accountant letters explaining discrepancies. The level of additional documentation should correspond to the significance of discrepancies.
Verification procedures should include independent confirmation of borrower explanations when possible. Contact merchants processors, landlords, or major customers to verify explanations for significant discrepancies.
Red Flags That Signal Potential Fraud
Income inflation tactics leave distinct signatures in cross-referencing analysis. Borrowers may inflate deposits through kiting schemes, create false invoices, or temporarily boost deposits during bank statement periods to qualify for larger advances.
Expense manipulation strategies often involve understating business costs to show higher profitability. This creates artificial cash flow that bank statements cannot support when considering the claimed expense levels.
Document alteration indicators include inconsistencies between tax returns and bank statements that suggest PDF manipulation, altered figures, or completely fabricated documents.
Income Fraud Indicators
Inflated deposits often show irregular patterns that don't align with normal business operations. Large, round-number deposits without clear sources or deposits that immediately transfer out suggest artificial inflation.
Kiting schemes involve moving money between accounts to create the appearance of higher deposits. This shows as rapid transfers between accounts or deposits immediately followed by withdrawals to other accounts.
False revenue sources may include deposits from personal accounts, loans disguised as income, or payments from shell companies. These deposits lack the characteristics of genuine business revenue.
Expense Manipulation Signs
Understated expenses appear when reported tax return expenses significantly under-represent actual business costs shown in bank statements. This artificially inflates reported profitability.
Personal vs business mixing becomes fraudulent when personal expenses are claimed as business deductions or when business accounts are used to hide personal spending patterns.
Missing major expenses raise flags when businesses report minimal overhead costs that don't align with bank statement withdrawal patterns. Every business has unavoidable costs that should appear consistently.
Document Integrity Issues
PDF manipulation leaves technical signatures that automated tools can detect. Font inconsistencies, layer analysis, and metadata examination reveal altered documents even when visual changes appear seamless.
Altered numbers often show subtle formatting inconsistencies, font variations, or mathematical errors that indicate post-creation modification. Professional document analysis tools can detect these alterations reliably.
Inconsistent formatting between pages or sections suggests document assembly from multiple sources or selective alteration of specific fields while leaving others original.
Seasonal Business Considerations
Understanding seasonal revenue patterns is crucial for accurate cross-referencing. Many MCA borrowers operate seasonal businesses with significant revenue fluctuations that affect income verification methodology.
Annualizing income for seasonal businesses requires understanding peak seasons, off-seasons, and transition periods. Simple monthly averaging doesn't work for businesses with 3-4 months of peak activity followed by minimal off-season revenue.
Matching bank statement periods to business cycles ensures representative income analysis. Reviewing only off-season bank statements for a pool maintenance company would severely understate annual income capacity.
Identifying Seasonal Business Patterns
Industry research helps identify common seasonal patterns. Tax preparation services peak in Q1, landscaping businesses in Q2-Q3, retail businesses in Q4, and tourism businesses vary by geography.
Historical patterns from previous years' tax returns or bank statements show business seasonality more clearly than single-period analysis. Three years of data reveals consistent patterns vs one-time fluctuations.
Monthly variance analysis within the provided bank statement period can indicate seasonal patterns even in limited data. Consistent month-to-month growth or decline suggests seasonal timing.
Adjusting Underwriting Criteria
Peak season weighting should reflect the business's annual cycle. A lawn care company showing strong Q2-Q3 performance should be evaluated based on annual projections, not winter-month cash flow.
Off-season considerations must account for reduced revenue periods when calculating debt capacity. Seasonal businesses need sufficient peak-season cash flow to cover payments during off-seasons.
Cash reserve requirements increase for seasonal businesses due to irregular revenue patterns. These businesses require larger cash cushions to weather off-season periods with continuing payment obligations.
Documentation Best Practices
Multi-year analysis provides the clearest picture of seasonal business performance. Three years of tax returns show consistent patterns and growth trends better than single-year snapshots.
Seasonal explanations should be documented in underwriting notes, including industry research supporting expected seasonal patterns and how the analysis accounts for these fluctuations.
Forward-looking projections help assess seasonal business capacity during off-peak periods. Conservative projections should account for potential seasonal variations and economic factors affecting peak seasons.
See ClearStaq's Cross-Referencing in Action
Watch ClearStaq simultaneously analyze tax returns and bank statements, automatically flagging discrepancies and generating fraud risk scores. See how automation eliminates manual work while catching what human reviewers miss.
Automation vs Manual Cross-Referencing
Benefits and limitations of manual review create trade-offs between thoroughness and efficiency. While human reviewers can catch subtle contextual issues, they struggle with consistency and speed when processing high volumes.
How automated tools enhance accuracy and speed becomes clear when processing hundreds of applications monthly. 27 fraud detection signals can be analyzed simultaneously across both document types in seconds rather than hours.
AI-powered transaction categorization and matching eliminates human error in classifying deposits and expenses. Machine learning models trained on millions of transactions achieve 95%+ accuracy in categorization tasks.
Manual Process Limitations
Time consumption for manual cross-referencing averages 45-90 minutes per application, depending on complexity and document length. This creates bottlenecks in high-volume lending operations.
Human error rates in manual review range from 15-25%, with errors increasing under time pressure or high workloads. Fatigue and inconsistent training compound these accuracy issues.
Consistency issues arise when different underwriters apply varying standards to similar discrepancies. Manual processes struggle to maintain uniform criteria across team members and time periods.
Scalability problems emerge as lending volume increases. Manual processes require linear increases in staff, while automated systems handle volume increases with minimal additional resources.
Automated Cross-Referencing Benefits
Speed improvements reduce analysis time from hours to minutes. Automated systems process both documents simultaneously, generating comprehensive comparison reports in under 5 minutes.
Accuracy gains result from consistent application of analysis criteria. Automated systems apply identical standards to every application, eliminating human variability and fatigue-related errors.
Fraud detection capabilities exceed human pattern recognition through analysis of multiple data points simultaneously. AI models identify subtle manipulation indicators that human reviewers often miss.
Audit trails automatically document every analysis step, creating comprehensive records for regulatory compliance and quality control purposes.
Implementing Automation in Your Workflow
Tool selection should prioritize accuracy, integration capabilities, and support for your document types. Evaluate tools based on their ability to handle your specific lending scenarios and business types.
Integration planning ensures smooth workflow incorporation without disrupting existing processes. Plan for data export formats, API connections, and staff training requirements.
Staff training focuses on interpreting automated results rather than performing manual analysis. Team members learn to validate flagged discrepancies and make final underwriting decisions based on comprehensive automated reports.
Quality control measures should include periodic manual verification of automated results to ensure ongoing accuracy and catch edge cases that may require system refinement.
{
  "status": "success",
  "fraud_score": 57,
  "transactions": 47,
  "bank": "Chase",
  "processing_time_ms": 238
}Best Practices for MCA Underwriters
Standardizing your cross-reference process ensures consistent analysis across all applications and team members. Written procedures eliminate variation and improve quality while reducing training time for new staff.
Documentation and audit trail requirements protect against regulatory scrutiny and investor due diligence. Every underwriting decision should be supported by clear documentation of the analysis performed and conclusions reached.
Training team members on key indicators helps maintain quality standards even as staff turnover occurs. Regular calibration sessions ensure team members apply consistent criteria to similar situations.
Developing Standard Operating Procedures
Process documentation should cover every step from document receipt through final underwriting decision. Include decision trees for common scenarios and escalation procedures for unusual cases.
Checklists ensure critical analysis steps aren't skipped during busy periods. Standard checklists should cover income verification, expense analysis, fraud indicators, and documentation requirements.
Approval workflows define authority levels for different discrepancy types and loan sizes. Clear workflows prevent bottlenecks while maintaining appropriate oversight for high-risk applications.
Team Training and Quality Control
Training materials should include real examples of acceptable and concerning discrepancies across different business types. Case studies help team members understand practical application of analysis criteria.
Regular calibration sessions involve team analysis of the same applications to ensure consistent interpretation of guidelines. These sessions identify training needs and refine procedures based on practical experience.
Performance metrics should track accuracy, speed, and consistency of analysis results. Regular performance review helps identify individual training needs and process improvement opportunities.
Technology Integration Strategy
Tool evaluation should include testing with your actual document types and business scenarios. Demo periods should cover edge cases and integration requirements specific to your operation.
Implementation planning should phase technology adoption to minimize workflow disruption. Start with high-volume, straightforward applications before expanding to complex cases.
ROI measurement should track time savings, accuracy improvements, and fraud prevention benefits. Calculate the full cost of manual processes including errors and missed fraud to understand automation value.
Consider comprehensive solutions that integrate with your existing MCA underwriting checklist and workflow. The best technology complements human expertise rather than replacing judgment entirely.
For advanced automation capabilities, explore MCA underwriting platforms that combine multiple analysis tools in integrated workflows designed specifically for alternative lending requirements.
Frequently Asked Questions
How do you cross reference bank statements with tax returns?
Compare Schedule C gross receipts against total business bank deposits, match reported expenses with actual withdrawals, and analyze timing differences. Look for variances beyond 5-15% that may indicate discrepancies or fraud.
What should match between bank statements and tax returns for MCA underwriting?
Gross business income should align with deposits, major expense categories should match withdrawal patterns, and the overall cash flow should support the reported profitability shown on the tax return.
What are red flags when comparing bank statements to tax returns?
Major red flags include income reported on taxes that doesn't appear in bank deposits, expenses on tax returns without corresponding withdrawals, round-number adjustments, and deposits from unexplained sources.
How do seasonal businesses affect the cross-referencing process?
Seasonal businesses require comparing tax returns to bank statements that cover the full business cycle, not just recent months. Underwriters must understand industry patterns and weight peak season performance appropriately.
What role does automation play in cross-referencing financial documents?
Automation speeds up the process by automatically categorizing transactions, matching them to tax return line items, flagging discrepancies, and generating fraud risk scores. This improves accuracy while reducing manual review time by 80%+.
Transform Your Underwriting with Automated Cross-Referencing
Transform your underwriting process with automated cross-referencing. ClearStaq's AI analyzes tax returns and bank statements simultaneously, flagging discrepancies in seconds instead of hours. Book a demo to see the future of MCA underwriting.
Frequently Asked Questions
How do you cross reference bank statements with tax returns?
Compare Schedule C gross receipts against total business bank deposits, match reported expenses with actual withdrawals, and analyze timing differences. Look for variances beyond 5-15% that may indicate discrepancies or fraud.
What should match between bank statements and tax returns for MCA underwriting?
Gross business income should align with deposits, major expense categories should match withdrawal patterns, and the overall cash flow should support the reported profitability shown on the tax return.
What are red flags when comparing bank statements to tax returns?
Major red flags include income reported on taxes that doesn't appear in bank deposits, expenses on tax returns without corresponding withdrawals, round-number adjustments, and deposits from unexplained sources.
How do seasonal businesses affect the cross-referencing process?
Seasonal businesses require comparing tax returns to bank statements that cover the full business cycle, not just recent months. Underwriters must understand industry patterns and weight peak season performance appropriately.
What role does automation play in cross-referencing financial documents?
Automation speeds up the process by automatically categorizing transactions, matching them to tax return line items, flagging discrepancies, and generating fraud risk scores. This improves accuracy while reducing manual review time by 80%+.
ClearStaq Team
Product Team
The ClearStaq team builds AI-powered tools for bank statement parsing, fraud detection, and income verification.