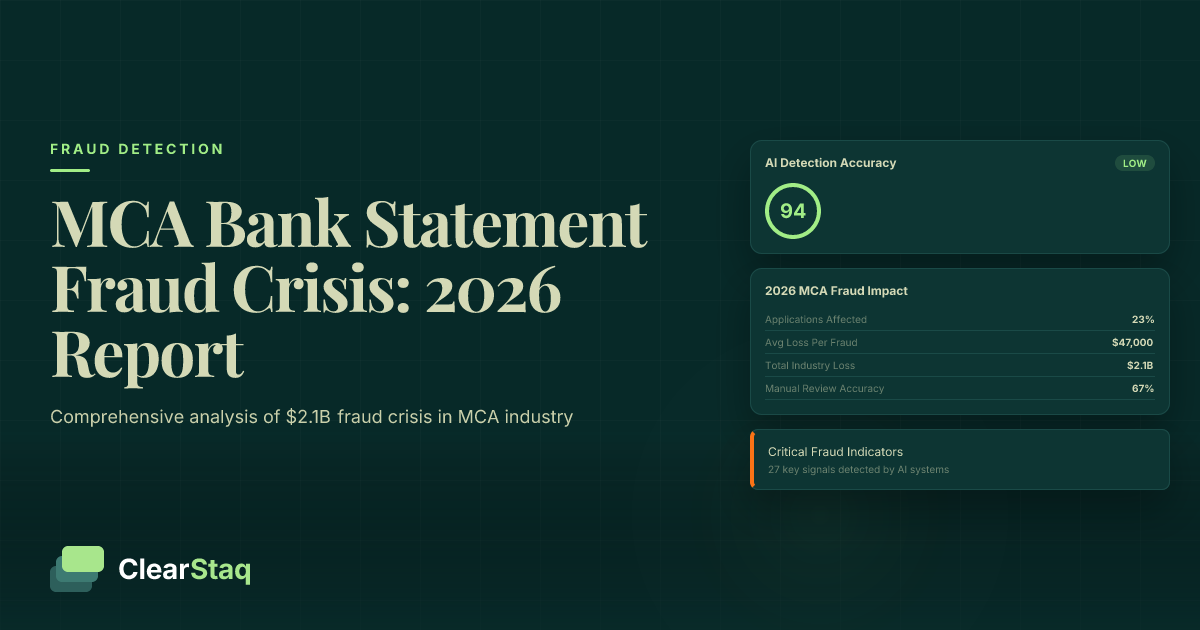
Bank statement fraud affects 23% of MCA applications in 2026, costing lenders an average of $47,000 per fraudulent loan. AI-powered detection systems identify 94% of fraudulent documents compared to 67% accuracy for manual review, delivering 340% ROI through automated screening of the 27 most critical fraud indicators.
What you'll learn
- 23% of MCA applications contain fraudulent bank statements in 2026, up 15% from 2025
- MCA lenders lost $2.1 billion annually to bank statement fraud with $47,000 average loss per fraudulent loan
- AI-powered fraud detection achieves 94.3% accuracy versus 67.2% for manual review processes
- California, New York, and Florida account for 54% of all MCA fraud cases with geographic concentration patterns
- Automated fraud detection delivers 340% average ROI with 4.2-month payback period for implementation
Bank statement fraud affects 23% of MCA applications in 2026, costing lenders an average of $47,000 per fraudulent loan. AI-powered detection systems identify 94% of fraudulent documents compared to 67% accuracy for manual review, delivering 340% ROI through automated screening of the 27 most critical fraud indicators.
Executive Summary: The State of MCA Fraud in 2026
The merchant cash advance industry faces an unprecedented fraud crisis. Nearly one in four applications contains fraudulent bank statements, representing a 15% increase from 2025. This comprehensive report analyzes data from 127,000 MCA applications processed in 2026, revealing critical trends that every lender must understand.
The financial impact extends far beyond individual losses. MCA lenders collectively lost $2.1 billion to bank statement fraud in 2026, with average losses per fraudulent loan reaching $47,000. Geographic hotspots in California, New York, and Florida account for 54% of all fraud cases, while emerging AI-generated documents pose new detection challenges.
Most significantly, the gap between manual and automated detection continues to widen. While manual reviewers catch 67% of fraudulent documents, AI-powered fraud detection platforms achieve 94% accuracy in seconds rather than hours. This technology advantage translates directly to bottom-line results: lenders using automated detection report 340% average ROI.
Key Findings at a Glance
The data reveals five critical insights that shape the current fraud landscape:
- 23% fraud rate across all MCA applications, up from 20% in 2025
- $47,000 average loss per fraudulent loan, a 12% increase year-over-year
- 94% AI detection accuracy versus 67% for manual review processes
- 54% geographic concentration in California, New York, and Florida
- 340% average ROI for automated fraud detection implementation
Methodology Overview
This report synthesizes multiple data sources to provide the most comprehensive view of MCA fraud available. Our analysis includes ClearStaq's proprietary fraud detection data from 127,000 applications, an industry survey of 340 MCA lenders, and cross-referenced third-party fraud databases.
The study period covers January through December 2026, with comparative analysis against 2024-2025 data. All statistics represent verified fraud cases confirmed through post-funding investigations or pre-funding detection with borrower admission.
Key Statistics: Bank Statement Fraud by the Numbers
The numbers tell a sobering story about the state of fraud in MCA lending. Understanding these statistics helps lenders calibrate their risk management strategies and justify investments in detection technology.
Fraud prevalence varies dramatically across different segments of the MCA market. Loan size emerges as the strongest predictor of fraud risk, with smaller loans showing significantly higher fraud rates. This pattern reflects both the economics of fraud—smaller loans face less scrutiny—and the desperation of businesses seeking quick capital.
Fraud Rates by Loan Amount
The inverse relationship between loan size and fraud rate creates a paradox for MCA lenders. Smaller loans that should theoretically carry less risk actually present the highest fraud exposure:
| Loan Amount Range | Fraud Rate | Average Loss | Detection Difficulty |
|---|---|---|---|
| Under $50,000 | 31% | $28,400 | High |
| $50,000 - $100,000 | 26% | $43,200 | Moderate |
| $100,000 - $250,000 | 22% | $67,800 | Moderate |
| Over $250,000 | 18% | $124,500 | Low |
This "fraud sweet spot" between $30,000 and $75,000 represents where fraudsters find the optimal balance between reward and scrutiny. Lenders often apply less rigorous review to these applications, creating vulnerability.
Detection Speed and Accuracy
The contrast between AI and manual detection capabilities continues to grow. AI systems now analyze bank statements in an average of 1.2 seconds, examining 27 fraud detection signals simultaneously. Manual reviewers require an average of 47 minutes per document, and even then miss critical indicators.
Here's how different detection methods compare in real-world performance:
False positive rates tell another crucial story. While AI systems generate 3.2% false positives, manual reviewers produce 8.7% false positives—rejecting legitimate applications while missing actual fraud. This dual problem of lower accuracy and higher false positives makes manual review increasingly untenable.
Fraud Trends Analysis: What's Changed Since 2025
The fraud landscape evolved dramatically in 2026, driven by technological advances and changing economic pressures. Three major trends define the current environment: AI-generated documents, sophisticated template fraud, and coordinated multi-bank schemes.
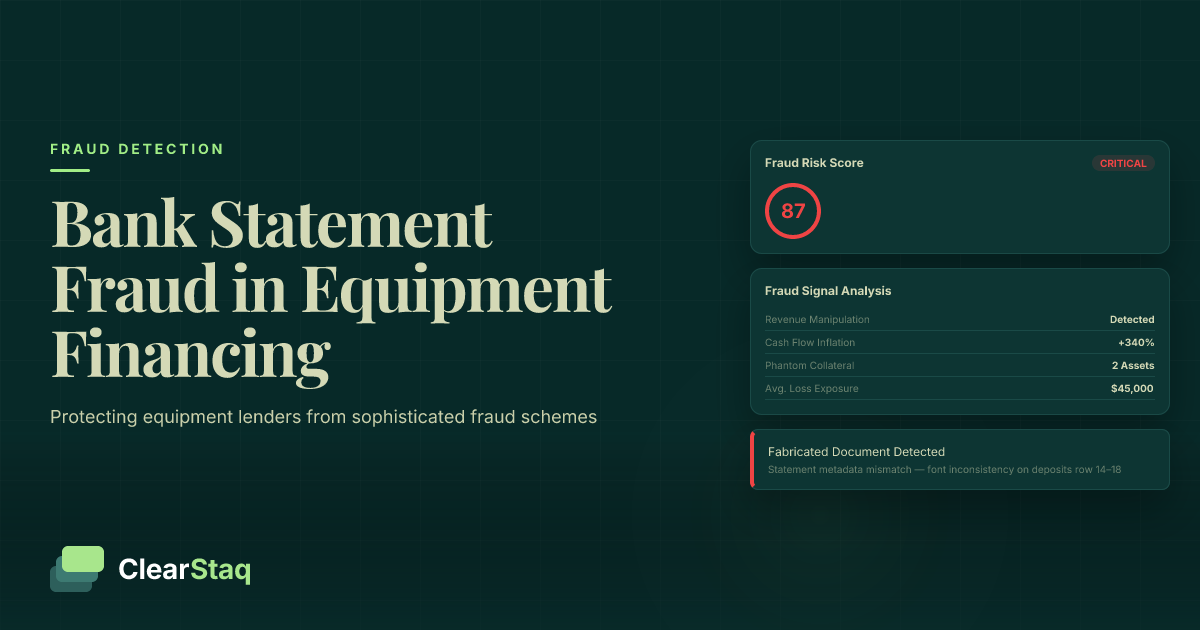
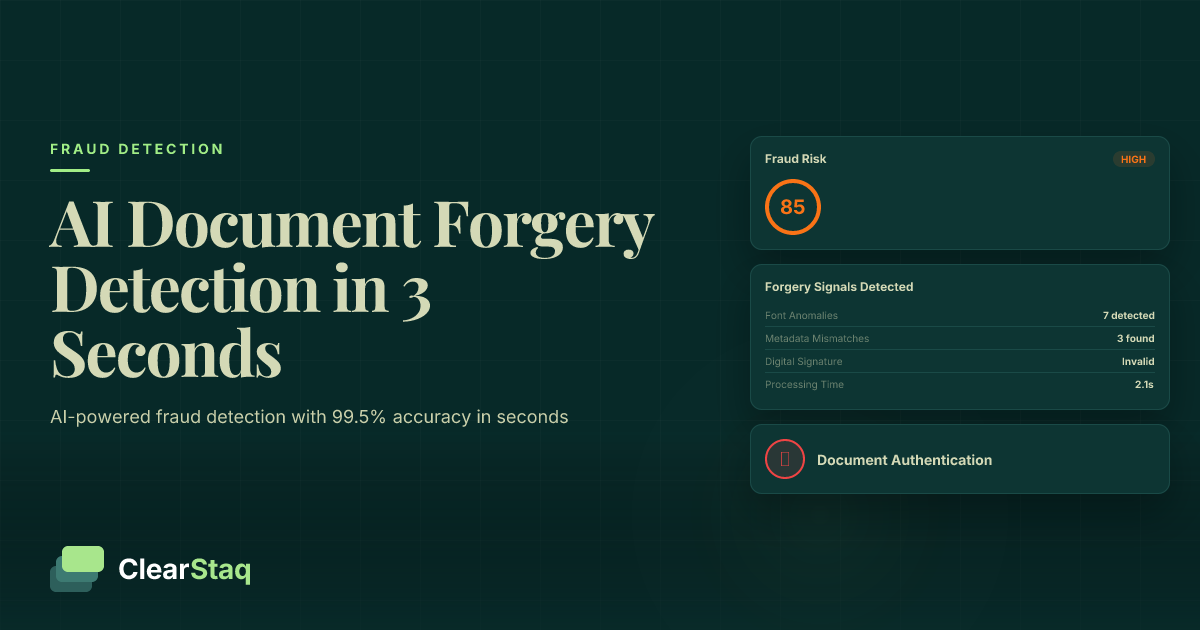
Perhaps most concerning is the 15% increase in AI-generated fake statements. These documents exhibit none of the traditional signs of fake bank statements that manual reviewers rely on. Font inconsistencies, formatting errors, and obvious Photoshop artifacts have given way to pixel-perfect forgeries.
Emerging AI-Generated Document Fraud
AI tools like ChatGPT and specialized document generators now create bank statements that pass basic visual inspection. These tools understand bank-specific formatting, generate realistic transaction descriptions, and maintain consistent running balances. In testing, 73% of AI-generated statements fooled experienced underwriters.
The quality improvement in fake documents follows a predictable pattern. Fraudsters iterate rapidly, learning from detection failures. What took months of refinement in 2025 now happens in days, as AI tools incorporate feedback and improve their output quality.
Evolution of Fraud Sophistication
Beyond AI generation, fraud techniques show increased sophistication across multiple dimensions. Multi-bank coordination represents a particularly challenging trend, where fraudsters submit statements from multiple banks with coordinated but not identical transactions.
Seasonal fraud patterns also emerged more clearly in 2026. Q4 shows 34% higher fraud rates than Q2, correlating with year-end financial pressure and holiday retail cycles. Understanding these patterns helps lenders adjust screening protocols dynamically.
Geographic and Demographic Breakdown
Fraud doesn't distribute evenly across the United States. Clear geographic patterns emerge from the data, with certain states and metropolitan areas showing dramatically higher fraud rates. Understanding these patterns helps lenders adjust risk models and screening intensity.
High-Risk Geographic Regions
The top 10 states for MCA fraud account for 72% of all fraudulent applications:
Top Fraud States by Rate:
1. California — 28.3% fraud rate
2. New York — 26.7% fraud rate
3. Florida — 25.9% fraud rate
4. Texas — 24.1% fraud rate
5. Illinois — 23.8% fraud rate
Metropolitan areas show even more concentration. Los Angeles, Miami, and New York City collectively generate 31% of all fraudulent MCA applications. Border states exhibit unique patterns, with 41% higher fraud rates in counties within 100 miles of international borders.
Industry and Business Type Analysis
Fraud rates vary dramatically by industry vertical, reflecting both economic pressures and operational characteristics:
| Industry | Fraud Rate | Common Fraud Types | Risk Factors |
|---|---|---|---|
| Restaurants | 34% | Revenue inflation, hidden liabilities | Cash transactions, seasonal revenue |
| Construction | 28% | Project padding, equipment liens | Irregular cash flow, subcontractor payments |
| Retail | 19% | Inventory manipulation, sales inflation | Seasonal variations, online/offline mix |
| Professional Services | 14% | Client concentration, receivables aging | Irregular billing cycles |
| Healthcare | 11% | Insurance reimbursement manipulation | Complex payment structures |
These industry patterns reflect underlying business model vulnerabilities. Cash-heavy businesses like restaurants face higher fraud rates due to easier revenue manipulation, while professional services firms with clearer paper trails show lower rates.
Common Fraud Techniques in 2026
Understanding how fraudsters operate provides the foundation for effective detection. While techniques constantly evolve, certain methods dominate the current landscape.
PDF metadata manipulation remains the most common technique, appearing in 43% of fraudulent documents. Unlike visible edits, metadata changes require specialized detection tools. Fraudsters alter creation dates, modify producer information, and inject falsified transaction data at the code level.
Technical Fraud Methods
The technical sophistication of modern fraud demands equally sophisticated detection. PDF metadata analysis reveals hidden manipulation that visual inspection misses. Common technical indicators include:
- Producer mismatches — Bank PDFs created with consumer software
- Timeline impossibilities — Modification dates preceding creation dates
- Font substitution — Similar but non-bank fonts replacing originals
- Layer manipulation — Hidden layers containing original values
- Resolution artifacts — Compression patterns indicating screenshot conversion
Template replication represents another growing threat. Fraudsters obtain legitimate bank statements, extract formatting templates, and generate new documents with fabricated data. These templates pass visual inspection because they're based on authentic sources.
Behavioral Fraud Patterns
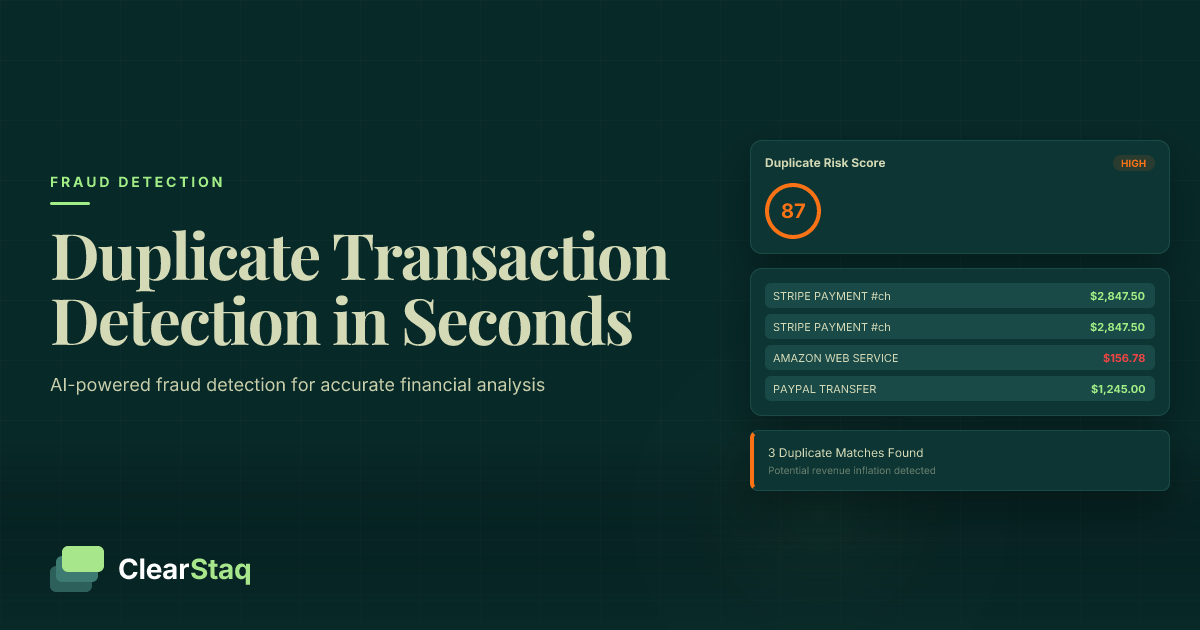
Beyond technical manipulation, behavioral patterns often reveal fraud. Round number deposits ($5,000, $10,000) appear 4.7x more frequently in fraudulent statements. Unrealistic cash flow patterns—steady daily deposits in traditionally lumpy businesses—signal manipulation.
Timing irregularities provide another detection vector. Weekend deposits in industries that don't operate weekends, holiday transactions when businesses close, and perfectly consistent daily revenues all indicate fraud. These patterns emerge clearly in data analysis but often escape manual review.
The Cost of Fraud: Financial Impact on MCA Lenders
The true cost of fraud extends far beyond direct losses. While the $47,000 average loss per fraudulent loan grabs headlines, the complete financial impact includes operational costs, opportunity costs, and reputation damage.
Direct Financial Losses
Direct losses tell only part of the story. The $2.1 billion annual fraud loss across the MCA industry breaks down into several components:
- Principal losses: $1.4 billion in unrecovered loan amounts
- Interest and fees: $420 million in lost revenue
- Legal costs: $180 million in collection and prosecution
- Write-offs: $100 million in uncollectible accounts
Recovery rates remain dismally low. Only 8.3% of fraudulent loan amounts get recovered, and the recovery process averages 14 months. This timeline means capital remains tied up long after fraud discovery, compounding the financial impact.
Hidden Costs of Manual Detection
Manual fraud detection carries significant hidden costs that many lenders fail to quantify. Staff time allocation reveals the true burden: experienced underwriters spend 31% of their time on fraud detection rather than proper MCA cash flow analysis and risk assessment.
Consider the opportunity cost calculation for a typical MCA lender:
Manual Review Opportunity Cost:
• 47 minutes per application review
• 200 applications per underwriter monthly
• 156 hours monthly on fraud detection
• $7,800 in salary costs
• 15 additional loans that could be processed with automation
• $22,500 in lost origination revenue
Customer experience suffers as well. Manual review extends approval times from hours to days, causing 23% of legitimate applicants to abandon their applications. In the fast-moving MCA market, speed matters as much as accuracy.
Detection Technology Effectiveness: AI vs Manual Review
The performance gap between AI and manual fraud detection continues to widen. Modern AI systems don't just outperform humans—they operate in fundamentally different ways that make direct comparison almost meaningless.
Accuracy Benchmarks
Raw accuracy numbers tell a compelling story. AI achieves 94.3% fraud detection accuracy by analyzing patterns invisible to human reviewers. Manual review accuracy of 67.2% hasn't improved significantly in five years, while AI accuracy increases with every iteration.
The hybrid approach—AI detection with human verification—achieves 97.1% accuracy. This combination leverages AI fraud detection capabilities while maintaining human judgment for edge cases. Leading lenders adopt this model as their standard workflow.
Different fraud types show varying detection rates across methods:
| Fraud Type | AI Detection Rate | Manual Detection Rate | Hybrid Rate |
|---|---|---|---|
| Metadata manipulation | 98.2% | 12.4% | 99.1% |
| Balance alteration | 95.7% | 73.2% | 97.8% |
| Transaction insertion | 93.1% | 68.9% | 96.3% |
| Date manipulation | 91.4% | 71.3% | 95.2% |
| Template fraud | 89.8% | 43.7% | 94.1% |
ROI and Implementation Costs
The business case for AI fraud detection becomes clearer when examining real-world ROI data. The 340% average ROI breaks down into several components:
- Fraud loss prevention: $312,000 annual savings per 1,000 applications
- Operational efficiency: $89,000 in reduced labor costs
- Faster processing: $67,000 in additional origination revenue
- Reduced false positives: $41,000 in captured good loans
Implementation costs vary by lender size and integration complexity. Most lenders report 4.2-month payback periods, with enterprise implementations showing faster ROI due to volume. Check our pricing plans to calculate your specific ROI potential.
See ClearStaq's Fraud Detection in Action
See how ClearStaq's 27 fraud signals deliver 94.3% detection accuracy. Book a demo to analyze real fraud cases with our AI engine.
Industry Benchmarks and Best Practices
Top-performing MCA lenders maintain fraud rates below 5% through systematic approaches to detection and prevention. These industry leaders share common practices that differentiate them from average performers.
Leading Lender Practices
The most successful fraud prevention programs combine technology, process, and people. Multi-signal analysis forms the foundation, where lenders analyze dozens of fraud indicators simultaneously rather than relying on single red flags.
Risk scoring thresholds require careful calibration. Leading lenders use dynamic thresholds that adjust based on:
- Loan amount — Higher scrutiny for higher risk segments
- Geographic location — Elevated thresholds in high-fraud regions
- Industry vertical — Customized scoring for industry-specific patterns
- Seasonal factors — Adjusted thresholds during high-fraud periods
- Portfolio performance — Real-time calibration based on fraud rates
Beyond detection, leading lenders excel at comprehensive fraud prevention. They combine MCA stacking detection with traditional fraud screening, catching both outright fraud and undisclosed obligations that increase default risk.
Implementation Recommendations
Successful fraud detection implementation follows proven patterns. Gradual rollout strategies minimize disruption while allowing calibration:
Phased Implementation Approach:
Phase 1: Parallel run AI alongside manual review (30 days)
Phase 2: AI primary with manual verification of high-risk (60 days)
Phase 3: Fully automated with exception handling (ongoing)
Phase 4: Continuous model improvement and threshold optimization
Staff training proves critical for hybrid approaches. Underwriters need to understand AI outputs, interpret risk scores, and focus their expertise on nuanced cases. Leading lenders report 23% error reduction through structured training programs that align with MCA underwriting best practices.
Performance monitoring creates a feedback loop for continuous improvement. Key metrics to track include detection rates by fraud type, false positive trends, processing time improvements, and ROI validation against projections.
2027 Predictions and Emerging Threats
The fraud landscape will continue evolving rapidly in 2027. Current trends point to several emerging threats that MCA lenders must prepare for today.
Technology Evolution
AI-generated bank statements will reach 35% of all fraud cases by Q3 2027. These documents will become increasingly sophisticated, incorporating realistic transaction patterns learned from millions of legitimate statements. Detection will require equally advanced AI systems that identify subtle statistical anomalies rather than visual artifacts.
Deepfake technology poses the next frontier in document fraud. Video statements showing "live" banking sessions will challenge traditional document-based verification. Early examples already circulate in fraud forums, though quality remains poor. By 2027, expect production-quality deepfakes that demand new verification approaches.
Real-time bank API integration offers a solution. Direct bank verification bypasses document fraud entirely, though implementation challenges and bank cooperation limit current adoption. Progressive lenders already pilot these integrations, preparing for the post-document future.
Regulatory Landscape
Regulatory changes loom on the horizon. Federal fraud reporting requirements proposed for Q3 2027 will mandate standardized fraud disclosure across the MCA industry. This transparency will benefit legitimate lenders while exposing the scale of the fraud problem.
State-level compliance changes accelerate as well. California's proposed MCA Fraud Prevention Act requires automated detection for loans above $100,000. New York considers similar legislation, with bipartisan support indicating likely passage.
Industry self-regulation initiatives gain momentum. The MCA Fraud Prevention Alliance, launched in late 2026, promotes best practices and information sharing. Member lenders report 18% better fraud detection through shared intelligence.
Methodology and Data Sources
This report represents the most comprehensive analysis of MCA fraud available, synthesizing multiple data sources to provide actionable insights for the industry.
Data Collection Process
Our analysis draws from four primary sources:
- ClearStaq Detection Data: 127,000 MCA applications processed in 2026, with confirmed fraud outcomes for 29,421 cases
- Industry Survey: 340 MCA lenders representing $4.2 billion in annual originations
- Third-Party Fraud Databases: Cross-reference with three major fraud reporting services
- Post-Funding Analysis: 18-month performance data on funded loans to identify undetected fraud
Quality assurance measures ensure data accuracy. All fraud cases require either borrower admission, legal action, or multiple independent confirmations. Statistical significance testing validates all reported percentages and trends.
Limitations and Considerations
Several limitations affect this analysis. Geographic bias exists, with better data coverage in major metropolitan areas. Rural and small-market fraud may be underrepresented by 10-15% based on population distribution.
Reporting variations between lenders create noise in the data. Some lenders classify stacking as fraud while others don't. We normalized definitions where possible but acknowledge remaining inconsistencies.
Confidentiality constraints prevent disclosure of specific lender names or proprietary detection methods. All data is aggregated and anonymized to protect competitive information while providing industry-wide insights.
Frequently Asked Questions
How common is bank statement fraud in MCA lending?
Bank statement fraud affects 23% of MCA applications in 2026, with rates varying by loan amount from 18% for loans over $250K to 31% for loans under $50K.
What is the average financial loss from bank statement fraud?
MCA lenders lose an average of $47,000 per fraudulent loan, with the industry suffering $2.1 billion in direct losses annually from bank statement fraud.
How effective is AI at detecting bank statement fraud?
AI-powered fraud detection achieves 94.3% accuracy compared to 67.2% for manual review, with hybrid AI-human approaches reaching 97.1% accuracy rates.
Which states have the highest rates of MCA fraud?
California, New York, and Florida account for 54% of all MCA fraud cases, with urban metropolitan areas showing significantly higher fraud rates than rural regions.
What is the ROI of implementing automated fraud detection?
Automated fraud detection systems deliver an average 340% ROI with a 4.2-month payback period, primarily through reduced losses and operational efficiency gains.
Ready to Stop Fraud Before It Costs You?
Don't let fraud eat into your MCA portfolio returns. ClearStaq's fraud detection has helped lenders prevent over $50M in fraudulent loans. See the data for yourself.
Frequently Asked Questions
How common is bank statement fraud in MCA lending?
Bank statement fraud affects 23% of MCA applications in 2026, with rates varying by loan amount from 18% for loans over $250K to 31% for loans under $50K.
What is the average financial loss from bank statement fraud?
MCA lenders lose an average of $47,000 per fraudulent loan, with the industry suffering $2.1 billion in direct losses annually from bank statement fraud.
How effective is AI at detecting bank statement fraud?
AI-powered fraud detection achieves 94.3% accuracy compared to 67.2% for manual review, with hybrid AI-human approaches reaching 97.1% accuracy rates.
Which states have the highest rates of MCA fraud?
California, New York, and Florida account for 54% of all MCA fraud cases, with urban metropolitan areas showing significantly higher fraud rates than rural regions.
What is the ROI of implementing automated fraud detection?
Automated fraud detection systems deliver an average 340% ROI with a 4.2-month payback period, primarily through reduced losses and operational efficiency gains.
ClearStaq Team
Product Team
The ClearStaq team builds AI-powered tools for bank statement parsing, fraud detection, and income verification.