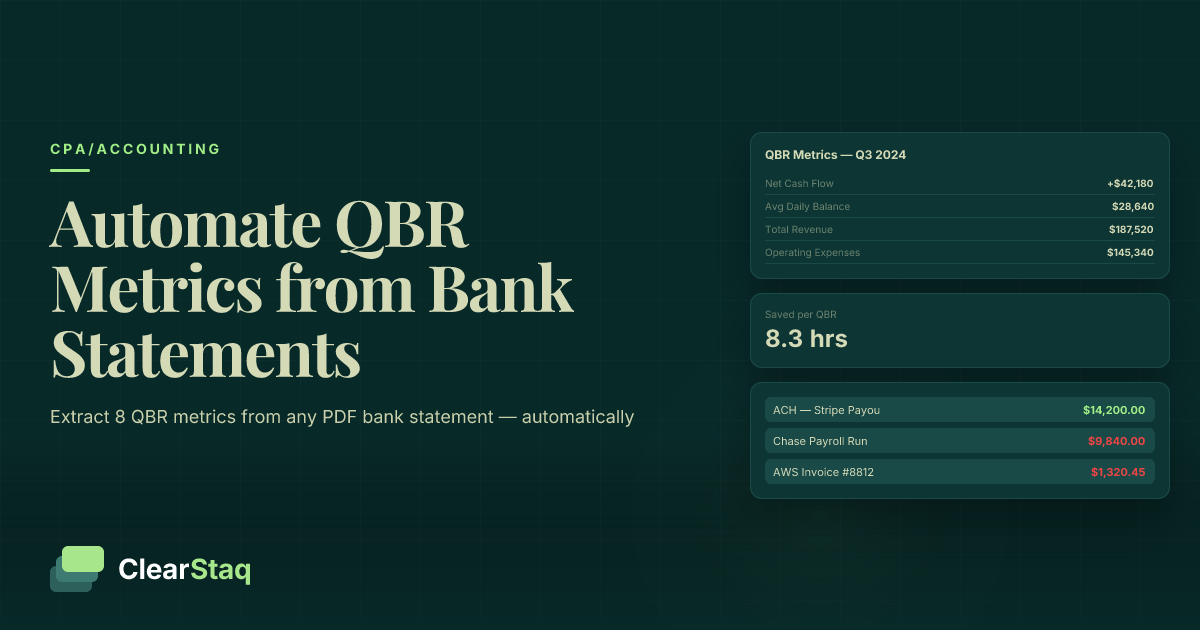
A quarterly business review (QBR) is a structured financial analysis CPAs conduct with clients every 90 days to evaluate performance, cash flow, and strategic direction. Automated bank statement parsing extracts the eight core metrics needed for every QBR — including net cash flow, average daily balance, and expense category breakdowns — directly from PDF statements, eliminating hours of manual data preparation.
What you'll learn
- CPAs can extract all eight core QBR metrics — including net cash flow, average daily balance, and NSF events — directly from raw PDF bank statements without a reconciled general ledger
- Manual QBR data preparation takes 4–8 hours per client per quarter; automated bank statement parsing reduces this to minutes
- Bank statement parsing works for any PDF from any institution, filling the gap that bank feed integrations leave for clients who don't use cloud accounting software
- Automated anomaly detection surfaces expense spikes, revenue gaps, and fraud indicators before the client meeting — elevating QBRs from reporting to genuine risk advisory
- Batch processing and API-level automation make it feasible to offer quarterly business reviews across 50+ clients without proportional increases in staff time
A quarterly business review (QBR) is a structured financial analysis CPAs conduct with clients every 90 days to evaluate performance, cash flow, and strategic direction. Automated bank statement parsing extracts the eight core metrics needed for every QBR — including net cash flow, average daily balance, and expense category breakdowns — directly from PDF statements, eliminating hours of manual data preparation.
What Is a Quarterly Business Review (and Why CPAs Should Own It)?
A quarterly business review is a structured 90-day check-in between a CPA and their business client. It's not a bookkeeping session. It's an advisory conversation — grounded in financial data, focused on performance trends, and oriented toward forward-looking decisions.
The AICPA has been clear about where the profession is heading: compliance work is increasingly commoditized, and the growth opportunity lies in advisory services. QBRs are the most natural expression of that shift. CPAs already hold the financial data. They understand the context. They can interpret the trends. What they often lack is a fast, repeatable way to prepare.
The business case is compelling too. Clients who receive regular advisory services from their CPA have significantly higher retention rates than those who only receive tax preparation and compliance work. A QBR program isn't just good for clients — it's a revenue stabilizer for the firm.
QBR vs. Monthly Financial Review: What's the Difference?
Monthly reviews focus on transaction-level accuracy: reconciling accounts, catching miscategorized expenses, and ensuring the books reflect reality. They're essential, but they're primarily backward-looking and operational.
QBRs zoom out. The analytical lens shifts from "are these numbers correct?" to "what do these numbers mean?" Trends matter more than individual transactions. Benchmarks come into play. And the deliverable isn't just a reconciled set of books — it's a client-facing presentation with recommendations.
The data inputs are similar, but the analytical frame and the client conversation are fundamentally different. Monthly reviews are table stakes. QBRs are where CPAs build lasting advisory relationships.
Why Bank Statements Are the Foundation of Every QBR
Bank statements provide ground-truth cash activity. Unlike accounting software entries, which can be adjusted or reclassified, bank statement data reflects exactly what moved through the account. That makes it the most reliable foundation for a QBR.
Not every SMB client uses cloud accounting software. Many still run on spreadsheets or desktop software that doesn't sync with anything. For those clients, bank statements are the universal data source — the one document every business has, regardless of how sophisticated their financial systems are.
Even clients who do use QuickBooks or Xero benefit from cross-referencing against raw bank statement data. The gap between what accounting software shows and what the bank statement reveals is exactly where anomalies hide. Learning to automate bank statement processing means closing that gap systematically, for every client, every quarter.
The Problem with Manual QBR Prep
Here's what manual QBR preparation actually looks like: a staff member downloads three months of bank statements as PDFs, opens a spreadsheet, and starts copying transaction data row by row. Then they build pivot tables to summarize by category. Then they double-check the totals. Then they find a discrepancy and trace it back to a miskeyed figure from page four of the February statement.
Industry estimates put the manual QBR data assembly time at 4–8 hours per client per quarter. For a firm with 40 advisory clients, that's 160–320 staff hours every 90 days — before a single client meeting has been scheduled. The hidden cost of manual bank statement review extends well beyond the obvious time investment.
The PDF Problem: Why Bank Feeds Don't Cover Every Client
Bank feed integrations — the live connections that pull transactions directly into QuickBooks or Xero — are often presented as the solution to manual data entry. They help, but they don't solve the whole problem.
A significant share of SMB clients still submit PDF statements rather than connecting live bank feeds. Some use community banks or credit unions that don't support direct feed integrations. Others are uncomfortable authorizing third-party access to their accounts. Some simply haven't gotten around to setting it up.
For those clients, the CPA's fallback is the same as it's always been: manually processing the PDF. This gap is almost entirely unaddressed in mainstream QBR automation discussions, which tend to assume that if a firm uses cloud accounting software, the data problem is solved. It isn't.
Errors in Manual Data Assembly and Their Downstream Impact
Transcription errors don't stay contained. One miskeyed figure distorts every metric calculated from it. A $1,500 expense entered as $15,000 inflates the operating cost total, compresses the apparent net cash flow, and generates a misleading quarter-over-quarter comparison — all from a single keystroke error.
Inconsistent expense categorization across staff members creates a different but equally damaging problem. When one person categorizes software subscriptions as "technology" and another uses "administrative expenses," the quarter-over-quarter data becomes non-comparable. Trend analysis breaks down.
Duplicate transaction detection is a particularly important safeguard. Double-counted transactions inflate revenue and distort cash flow calculations in ways that are hard to catch manually — especially when reviewing three months of data across multiple accounts.
The 8 Key Metrics CPAs Should Extract from Bank Statements for Every QBR
Every QBR needs a core data package. The following eight metrics can all be derived directly from raw bank statement transactions — no reconciled general ledger required, no P&L needed. They map directly to the questions clients ask most often and the advisory conversations that matter most.
Cash Flow Metrics: Net Cash Flow, Average Daily Balance, and Cash Burn Rate
Net cash flow is total credits minus total debits over the quarter. It's the single most important number in any QBR. A business can show strong gross deposits and still be cash-flow negative if expenses are growing faster than revenue. Net cash flow tells that story immediately.
Average daily balance is derived by summing end-of-day balances and dividing by the number of days in the period. It's a key liquidity indicator — it tells you not just how much cash is in the account today, but how much has been available on average. A business can maintain a healthy end-of-quarter balance while running dangerously low mid-quarter.
Cash burn rate matters most for early-stage or loss-making clients. It calculates the rate at which cash reserves are being depleted. Automated parsing extracts and calculates each of these metrics without manual summation — the numbers are ready the moment the PDF is processed.
Understanding how these metrics shift across quarters is significantly more valuable in context. Reviewing seasonal revenue patterns alongside quarter-over-quarter cash flow data gives clients a framework for understanding whether a dip is a problem or simply the rhythm of their business.
Revenue Metrics: Gross Deposits, Revenue Trends, and Recurring vs. Non-Recurring Income
Gross deposits serve as a proxy for gross revenue when a P&L is unavailable or unreconciled. They're not a perfect substitute, but for a QBR — where the goal is directional insight, not audit-level precision — they're a reliable and immediately available figure.
The more nuanced analysis comes from distinguishing recurring revenue streams from one-time deposits. Automated tools identify recurring patterns by analyzing transaction description text: regular ACH deposits from the same payer, consistent weekly or monthly credit amounts, or identifiable client name patterns all signal recurring income.
The quarter-over-quarter revenue trend — the percentage change in total credits versus the prior quarter — is one of the most conversation-starting metrics in a QBR. But accurate trend analysis requires that loan proceeds, intercompany transfers, and other non-operating credits are excluded. This is where automated categorization earns its keep.
Expense Metrics: Top Expense Categories, Fixed vs. Variable Costs, and Payroll Identification
Automated expense categorization maps every transaction to an IRS-compliant chart of accounts category without manual review. The result is a clean expense summary organized by category — advertising, utilities, professional services, office supplies — ready to drop into a QBR presentation. For a deeper look at how this works, see our guide to automated expense categorization.
The fixed vs. variable expense split is a metric most clients have never seen presented clearly. Fixed costs (rent, software subscriptions, loan payments) represent operational leverage — they're the floor the business must clear before reaching profitability. Variable costs flex with revenue. Understanding the ratio helps clients make better decisions about hiring, capacity, and pricing.
Payroll identification from ACH transaction patterns is critical for most SMB clients. Regular, consistent ACH debits to a payroll processor or direct deposits to employees are identifiable from transaction descriptions. Payroll is typically the largest expense line — surfacing it clearly in the QBR report anchors the entire cost conversation.
Liquidity and Risk Metrics: NSF Events, Overdraft Days, and Minimum Balance Trends
NSF fees and overdraft events are leading indicators of cash management stress. A single NSF event is a data point. Three or four in a quarter is a pattern — one that warrants a direct advisory conversation about cash flow timing, receivables acceleration, or credit line utilization.
Number of negative balance days per quarter tracks deterioration in the liquidity position more precisely than the end-of-quarter balance alone. A business that ends the quarter with $50,000 in its account but spent 15 days in negative territory has a materially different financial health profile than one that maintained positive balances throughout.
Minimum balance trends answer a simple but important question: is the business maintaining a cash cushion, or is it running lean? Tracking the minimum balance across consecutive quarters reveals whether liquidity is improving or eroding — long before it becomes a crisis.
These risk metrics elevate a QBR from a reporting exercise to genuine financial advisory. They're the metrics that make clients say "I didn't know you could see that."
The table above shows how raw bank statement transactions are structured after parsing — each transaction tagged with a date, amount, description, category, and running balance. All eight QBR metrics are derived directly from this structured output.
How Automated Bank Statement Parsing Transforms the QBR Workflow
Bank statement parsing is the process of feeding a PDF bank statement into an AI-powered tool and receiving structured, categorized transaction data as output. No manual entry. No spreadsheet formulas. The document goes in; analytics-ready data comes out.
The key distinction from bank feed integrations is that parsing works on any PDF from any institution — no API connection, no client authorization, no accounting software integration required. The client submits their PDF statement the same way they'd submit any document. The parsing tool does the rest.
The output is structured JSON or CSV that feeds directly into reporting dashboards, QBR templates, or practice management software. From 4–8 hours of manual prep to minutes of automated extraction — that's the QBR efficiency case in a single sentence.
Bank Feed vs. Bank Statement Parsing: Understanding the Difference
| Feature | Bank Feed Integration | Bank Statement Parsing |
|---|---|---|
| Data source | Live API connection to bank | PDF document submitted by client |
| Client requirement | Must authorize and connect account | No authorization needed — just submit PDF |
| Bank coverage | Limited to supported institutions | 900+ bank formats supported |
| Works without cloud accounting software | No | Yes |
| Historical data access | From connection date forward | Any statement, any date range |
| Setup per client | Requires client onboarding | No setup — upload and process |
For CPA firms with diverse client bases, parsing is often the primary method — not just the fallback. 900+ bank format support means no statement is unprocessable regardless of the institution or statement layout.
From PDF Upload to QBR-Ready Data: The Parsing Pipeline
The process runs in five steps:
- Client submits PDF bank statement — via email, client portal upload, or API
- Parser identifies bank format and extracts all transactions with dates, amounts, descriptions, and running balance
- Expense categorization AI maps each transaction to a chart of accounts category automatically
- Duplicate detection flags any repeated transactions that would distort metric calculations
- Structured output (JSON or CSV) is ready for import into a reporting dashboard or QBR template — no re-keying required
The pipeline above illustrates the document-to-structured-data transformation. What previously required a staff member and several hours now completes automatically in under a minute. CPAs who automate bank statement processing eliminate the most time-consuming step in QBR preparation entirely.
Step-by-Step: Running a QBR with Automated Data Extraction
Here's a concrete workflow CPAs can follow today. Each step includes an honest time estimate — with and without automation — so the ROI case is clear.
Pre-Meeting Prep (Days Before the QBR)
- Request bank statements from client — or trigger automatic document collection if using a client portal. (With automation: automated reminder sent; manual: email or call per client)
- Upload statements to parsing tool — batch upload if processing multiple months or multiple accounts. (With automation: 2 minutes; manual: N/A — this step doesn't exist)
- Review auto-generated metric summary — net cash flow, average daily balance, top expense categories, NSF events. (With automation: 10–15 minutes; manual: 4–8 hours)
- Identify anomalies flagged by the system — review any outliers or risk signals before the meeting. (With automation: flagged automatically; manual: requires line-by-line review or gets skipped entirely)
- Export structured data into QBR report template — no re-keying required. (With automation: 5 minutes; manual: 1–2 hours)
The QBR Meeting: Presenting Bank Statement Insights to Clients
Lead with cash flow. Clients care most about whether the business has enough money and where it went. Net cash flow and average daily balance give you a clear, non-technical opening that lands immediately.
Use quarter-over-quarter comparisons to frame every metric. Absolute numbers mean less than direction. A net cash flow of $42,000 is good or bad depending entirely on whether last quarter was $38,000 or $67,000.
Walk through the top three expense categories and ask the client whether each reflects their expectations. "Your software costs are up 34% from last quarter — does that match anything you recall approving?" That one question can surface a billing error, a price increase, or an unauthorized subscription.
Surface any NSF events or negative balance days as a natural segue into cash management advisory. These aren't accusatory data points — they're an opening for a conversation about payment timing, receivables acceleration, or credit line strategy.
Close with forward-looking recommendations tied directly to the data. This is the advisory value that justifies higher fees. "Based on your current cash burn rate and your average balance trend, you have approximately 90 days of runway at this expense level. Here's what I'd recommend looking at."
Post-Meeting: Delivering the QBR Report
Generate a clean PDF or dashboard report from the structured data output — no additional manual assembly. Archive the structured data for next quarter's year-over-year comparison. Set up automated reminders for next quarter's statement collection. Document any action items agreed in the meeting, linked to specific metric targets so progress is measurable.
The parsed transaction data doesn't stop being useful after the QBR. The same structured output feeds other workflows — including extracting contractor payments from bank statements for 1099 preparation later in the year.
Spotting Anomalies and Red Flags During the QBR Process
This is the capability no competitor's QBR guide addresses — and it's the one that transforms a QBR from a reporting service into genuine financial risk advisory.
Automated parsing doesn't just extract metrics. It surfaces statistical outliers, pattern deviations, and potential fraud signals in the transaction data — automatically, before the client meeting. The CPA walks in prepared to discuss not just what happened, but what looks unusual.
Internal Business Anomalies: Unusual Expense Spikes and Revenue Gaps
A sudden spike in a single expense category — say, "professional services" doubling from one quarter to the next — could signal an unauthorized spend, a vendor price increase, or a billing error. Without automated flagging, this spike gets buried in the data. With it, it surfaces before the meeting starts.
Revenue gaps are equally telling. If a client normally receives $40,000–$50,000 in deposits during October and this year's October shows $22,000, something has changed. It might be a lost client, a missed invoice, or a seasonal shift. It's worth asking. Automated tools flag statistical outliers in transaction data without requiring the CPA to scan thousands of lines manually.
Large round-number transactions with no clear vendor attribution are another category worth flagging for client explanation. "$10,000 — wire transfer" with no further description attached is a conversation starter, not an assumption.
Fraud Indicators CPAs Should Flag in Client Bank Statements
The fraud indicators that surface in client bank statements during a QBR fall into several distinct patterns:
- Duplicate transactions with slight date or amount variations — could indicate duplicate billing, payroll fraud, or vendor manipulation
- Unfamiliar recurring ACH debits — unauthorized subscriptions, vendor fraud, or compromised account credentials
- Transactions to high-risk merchant categories inconsistent with the client's business type — a landscaping company with recurring charges to an offshore gambling platform deserves an explanation
- Metadata or formatting anomalies in submitted PDFs — font inconsistencies, editing artifacts, or suspicious document properties that suggest manipulation
For CPAs who want to go deeper on this topic, our guide to bank statement fraud red flags covers the full spectrum of document-level and transaction-level indicators that automated tools are trained to detect.
The alert feed above shows how automated anomaly detection surfaces in real time during document processing. Each flag arrives with context — the transaction details, the detection reason, and a severity rating — so the CPA can review it in seconds rather than hunting for it manually.
See ClearStaq's QBR Automation in Action
See how ClearStaq extracts all eight QBR metrics from a PDF bank statement in under 60 seconds. Book a demo and bring a sample statement.
How ClearStaq Helps CPAs Automate QBR Data Extraction
ClearStaq is built specifically for the workflow described throughout this post: PDF bank statement goes in, QBR-ready structured data comes out. It's not a general-purpose accounting tool. It's a CPA automation platform designed around the document processing step that every other QBR automation discussion ignores.
Key Features for the QBR Workflow
- Automated metric extraction — net cash flow, average daily balance, expense categories, and NSF events calculated automatically from PDF upload
- Automated expense categorization — every transaction mapped to a chart of accounts category without manual review, using consistent rules across all clients
- Duplicate transaction detection — prevents double-counted revenue from distorting quarterly metrics before they reach the QBR report
- Anomaly flagging — statistical outliers and potential fraud signals surfaced automatically with severity ratings and transaction context
- Batch processing — upload statements for all clients at once; QBR data packages ready in minutes, not days
- 900+ bank format support — no statement is unprocessable regardless of institution, layout, or regional format
Integrating ClearStaq into Your Existing QBR Workflow
Structured JSON output integrates with Excel, Google Sheets, Power BI, and custom dashboards without re-keying. If a firm's QBR template already lives in a spreadsheet or dashboard tool, the parsed output flows directly into it.
For high-volume firms, API access enables fully automated pipelines: statement received → parsed → metrics calculated → report generated. No human touches the data until the CPA is reviewing the completed output.
Clients don't need to change anything. They submit PDFs exactly as they always have. ClearStaq handles the rest. It works alongside QuickBooks and Xero rather than replacing them — filling the gap those tools leave for clients who aren't connected.
For firms handling large client volumes, multi-client bank statement processing explains how to structure the batch workflow across an entire client roster. For a sense of what's possible at scale, the case study on processing hundreds of bank statements at scale shows how automation changes the economics of high-volume CPA practices.
Scaling QBRs Across Your Entire Client Base
Manually, QBRs don't scale. At 4–8 hours of prep per client, a firm with 40 advisory clients is looking at 160–320 hours of quarterly data assembly work. That's two full-time staff members working on nothing but QBR prep for weeks. Most firms cap their QBR program at 10–15 clients not because they don't want to offer the service — but because the math doesn't work.
Automation changes the math entirely. Batch processing means 50 clients takes the same time as five. The constraint shifts from data preparation to advisory capacity — which is exactly where it should be.
Standardizing the QBR Data Package Across All Clients
Standardization is the prerequisite for scaling. Every client gets the same eight metrics extracted using the same categorization rules. The QBR report template populates automatically from the structured output. Nothing is customized per engagement at the data level — customization happens in the advisory conversation, not in the spreadsheet.
Standardization also makes delegation easier. Junior staff can manage the document collection and upload pipeline. The parsing and metric calculation happen automatically. Partners review the outputs and prepare for the advisory conversation. The cognitive load is distributed appropriately.
Building an API-Powered QBR Pipeline
For high-volume firms, the logical endpoint is a fully automated pipeline. When a client submits a bank statement through the firm's portal, the API triggers parsing automatically. Webhook notifications alert the CPA when the data package is ready for review. The entire collect → upload → wait → review cycle collapses into a single notification.
This is how QBRs become a scalable advisory product rather than a high-touch manual service. The economics change. The service becomes profitable at client volumes that would be impossible to serve manually. For a detailed look at how to structure this pipeline, see our guide to batch processing bank statements at scale.
Frequently Asked Questions
What is a quarterly business review for CPAs?
A quarterly business review (QBR) is a structured advisory meeting CPAs conduct with clients every 90 days to analyze financial performance, review key metrics like cash flow and expense trends, and provide forward-looking recommendations. Unlike monthly bookkeeping check-ins, QBRs focus on strategic insight rather than transaction-level accuracy.
What financial metrics should be included in a QBR?
The core metrics CPAs should extract for every QBR include net cash flow, average daily balance, gross deposits, quarter-over-quarter revenue trend, top expense categories, fixed vs. variable cost split, NSF event count, and minimum balance trends. All eight can be derived directly from bank statement data without requiring a reconciled general ledger.
How can CPAs automate bank statement analysis for quarterly reviews?
CPAs can use bank statement parsing software to automatically extract and categorize all transactions from PDF statements submitted by clients. The parsed output — including cash flow metrics, expense summaries, and anomaly flags — feeds directly into QBR report templates, eliminating the manual data assembly step that typically takes 4–8 hours per client.
What is the difference between bank feed data and parsed bank statement data?
Bank feeds pull transaction data in real time via a live API connection, which requires the client to authorize access through their accounting software. Bank statement parsing processes a PDF document the client submits — no integration or client authorization required. Parsing works for any bank, any format, and any client regardless of whether they use cloud accounting software.
How long does it take to prepare a QBR with automation tools?
With automated bank statement parsing, QBR data preparation for a single client takes minutes rather than hours — the tool extracts all metrics, categorizes expenses, and flags anomalies automatically upon PDF upload. Batch processing enables firms to prepare QBR data packages for 50+ clients simultaneously, making it feasible to offer quarterly reviews across an entire client roster.
Ready to Automate Your QBR Data Preparation?
Stop spending 4–8 hours assembling QBR data manually. ClearStaq extracts every metric you need — cash flow, expense categories, anomalies — automatically, so you can spend your time on the advisory conversation that actually grows your practice. Explore pricing plans or book a demo to see it with a real statement.
Frequently Asked Questions
What is a quarterly business review for CPAs?
A quarterly business review (QBR) is a structured advisory meeting CPAs conduct with clients every 90 days to analyze financial performance, review key metrics like cash flow and expense trends, and provide forward-looking recommendations. Unlike monthly bookkeeping check-ins, QBRs focus on strategic insight rather than transaction-level accuracy.
What financial metrics should be included in a QBR?
The core metrics CPAs should extract for every QBR include net cash flow, average daily balance, gross deposits, quarter-over-quarter revenue trend, top expense categories, fixed vs. variable cost split, NSF event count, and minimum balance trends. All eight can be derived directly from bank statement data without requiring a reconciled general ledger.
How can CPAs automate bank statement analysis for quarterly reviews?
CPAs can use bank statement parsing software to automatically extract and categorize all transactions from PDF statements submitted by clients. The parsed output — including cash flow metrics, expense summaries, and anomaly flags — feeds directly into QBR report templates, eliminating the manual data assembly step that typically takes 4–8 hours per client.
What is the difference between bank feed data and parsed bank statement data?
Bank feeds pull transaction data in real time via a live API connection, which requires the client to authorize access through their accounting software. Bank statement parsing processes a PDF document the client submits — no integration or client authorization required. Parsing works for any bank, any format, and any client regardless of whether they use cloud accounting software.
How long does it take to prepare a QBR with automation tools?
With automated bank statement parsing, QBR data preparation for a single client takes minutes rather than hours — the tool extracts all metrics, categorizes expenses, and flags anomalies automatically upon PDF upload. Batch processing enables firms to prepare QBR data packages for 50+ clients simultaneously, making it feasible to offer quarterly reviews across an entire client roster.
ClearStaq Team
Product Team
The ClearStaq team builds AI-powered tools for bank statement parsing, fraud detection, and income verification.