MCA deposit pattern analysis classifies a merchant's revenue as recurring (frequent, predictable deposits) or lumpy (irregular, project-driven, or event-based deposits). Underwriters use metrics like deposit frequency, coefficient of variation, and deposit velocity to quantify consistency. Recurring revenue signals lower repayment risk; lumpy revenue requires adjusted advance sizing, higher factor rates, or additional conditions for approval.
What you'll learn
- Deposit pattern predictability is the primary repayment risk proxy for MCA underwriters — more predictive than credit score or DSCR
- Coefficient of variation (CV = SD / Mean) is the core quantitative measure of deposit consistency, with values below 0.3 indicating a strong recurring profile
- Lumpy revenue businesses can qualify for MCAs when pattern stability, sufficient average daily balance, and conservative advance sizing conditions are met
- Large one-time deposits must be normalized before advance sizing — gross monthly deposit totals overstate sustainable cash flow for irregular businesses
- Automated bank statement parsing computes deposit frequency, CV, and velocity in seconds, enabling 10x more applications with the same underwriting team
MCA deposit pattern analysis classifies a merchant's revenue as recurring (frequent, predictable deposits) or lumpy (irregular, project-driven, or event-based deposits). Underwriters use metrics like deposit frequency, coefficient of variation, and deposit velocity to quantify consistency. Recurring revenue signals lower repayment risk; lumpy revenue requires adjusted advance sizing, higher factor rates, or additional conditions for approval.
Why Deposit Patterns Are the Core of MCA Risk Assessment
Unlike term loans, where repayment comes from a scheduled monthly payment regardless of daily cash flow, merchant cash advances pull directly from a business's ongoing receivables. Daily or weekly remittances mean the merchant must have money moving through the account on a consistent basis. That makes deposit behavior — not credit score, not tax returns — the most direct predictor of repayment performance.
Traditional credit metrics like FICO scores and debt service coverage ratios (DSCR) measure historical creditworthiness or annual income ratios. They don't capture what an MCA actually depends on: the rhythm of cash coming into the account week after week. According to the Federal Reserve's Small Business Credit Survey, many of the businesses that turn to alternative financing like MCAs operate with volatile or uneven revenue — making deposit pattern analysis even more critical than it would be for conventional borrowers.
The two archetypes that structure this analysis are recurring revenue and lumpy revenue. They represent opposite ends of a deposit pattern spectrum, and understanding where a business falls determines advance sizing, factor rate, holdback percentage, and ultimately approval or decline.
How MCA Repayment Mechanics Make Deposit Patterns Critical
MCA remittances — whether structured as a fixed daily ACH or a percentage holdback on card settlements — hit the account every business day. If deposits arrive irregularly, the account balance can drop to near zero in the days or weeks between large deposit events. A single failed remittance triggers a fee. A string of failed remittances signals default.
In term lending, a missed month can often be cured within a grace period. In MCA, the damage accumulates daily. A business that goes ten days without a deposit while remitting $400 per day will have burned through $4,000 in capital before the next check arrives. That fragility is why deposit pattern predictability is the primary risk proxy for MCA underwriters — not an afterthought.
Factor rate pricing reflects this directly. A business with highly predictable daily deposits represents lower repayment risk, so it qualifies for a tighter factor rate. A business with unpredictable, infrequent deposits commands a higher factor rate to compensate for the elevated risk of remittance failure during deposit gaps.
What 3–6 Months of Bank Statements Actually Reveal
Most MCA underwriters require a minimum of three months of bank statements. Three months captures recent behavior — whether a business is currently active, what its current deposit cadence looks like, and whether any recent disruptions have occurred. Six months is better because it surfaces trends: is deposit frequency increasing, decreasing, or holding steady? Is volume growing or contracting?
A single month's data is almost always misleading. One strong month from a large contract payment or seasonal spike can make an otherwise irregular business look like a consistent performer. Conversely, one bad month from a slow season can understate a healthy business. Multi-month review is the only way to distinguish a pattern from a moment.
Deposit pattern analysis sits within a broader underwriting framework. For context on the full set of criteria underwriters evaluate alongside deposit patterns, see the MCA underwriting checklist.
Recurring Revenue: What It Looks Like in a Bank Statement
Recurring revenue, in the MCA underwriting context, means deposits that arrive at regular intervals with consistent volume. When you pull up the transaction history of a recurring revenue business, the deposit column looks dense and even — entries nearly every business day, amounts clustering tightly around a consistent average.
The classic examples: a quick-service restaurant with daily POS batch settlements hitting the account each morning. A SaaS company receiving bi-weekly ACH payouts from Stripe or Braintree. A staffing agency getting weekly client ACH payments every Thursday. The business model drives the deposit rhythm, and that rhythm is what underwriters are reading.
Recurring revenue businesses typically qualify for higher advance amounts and tighter factor rates because their repayment risk is demonstrably lower. The account will almost certainly have money in it tomorrow, and the day after that. Remittance failure risk is low when the deposit stream is continuous.
Business Types That Naturally Generate Recurring Deposits
Several business categories reliably produce recurring deposit patterns:
- Retail with card terminals: Daily batch settlements from Visa, Mastercard, and Amex create a deposit for virtually every business day. Volume varies somewhat by day of week, but the frequency is near-daily and predictable.
- Full-service and quick-service restaurants: Nightly POS batch closes and tip settlements hit the account daily. Weekend volume is higher, but the pattern holds seven days a week for active locations.
- SaaS and subscription businesses: Monthly or bi-weekly ACH payouts from payment processors like Stripe, Square, or PayPal produce consistent deposit timing. For subscription revenue validation in SaaS-specific contexts, the nuances of processor payout timing matter for accurate income assessment.
- E-commerce on marketplace platforms: Shopify Payments, Amazon Seller Central, and similar platforms disburse on predictable weekly or bi-weekly schedules, creating a clockwork deposit pattern.
How Underwriters Score a Recurring Revenue Pattern
Deposit frequency count — the total number of individual deposits in a month — is the starting point. A business showing 20+ deposits in a month is signaling daily or near-daily cash flow activity. But frequency alone isn't enough. Two businesses can each have 20 deposits per month while one has tight, consistent amounts and the other swings wildly between $200 and $25,000.
That's where the coefficient of variation (CV) enters the analysis. CV is calculated as the standard deviation of deposit amounts divided by the mean deposit amount (CV = SD / Mean). It expresses variability as a proportion of the average, making it comparable across businesses of different sizes.
Indicative CV benchmarks for deposit pattern scoring:
| CV Range | Pattern Classification | Underwriting Signal |
|---|---|---|
| Below 0.3 | Highly consistent | Strong recurring profile; supports higher advance multiples and tighter factor rates |
| 0.3–0.5 | Moderately consistent | Acceptable recurring signal with minor volatility; standard underwriting applies |
| 0.5–0.8 | Moderately irregular | Mixed pattern; conservative advance sizing recommended; ADB review required |
| Above 0.8 | Highly irregular | Lumpy revenue profile; normalize deposits, reduce advance multiple, increase factor rate |
Days-between-deposit scoring adds a timing dimension: shorter average gaps with tight variance across those gaps indicate a business that consistently receives money on a predictable schedule. A business averaging 1.2 days between deposits scores far better than one averaging 8.4 days with a standard deviation of 6 days.
The income chart above illustrates the contrast visually: a recurring revenue business produces a flat, dense deposit curve with minimal amplitude variation across months. A lumpy business produces a spiked profile — several large events separated by long flat stretches. That visual difference translates directly into the CV scores described above.
Lumpy Revenue: Characteristics, Causes, and Risk Implications
Lumpy revenue describes deposits that arrive in large, infrequent, irregular bursts. The underlying cause is always the business model: construction contractors receive progress draw payments tied to project milestones. Event venues collect deposits when bookings happen and final payments when events occur. Consulting firms invoice net-30 or net-60 and receive payment accordingly.
In a lumpy revenue bank statement, the deposit column is sparse. Large amounts appear a few times per month — or sometimes a few times per quarter — surrounded by long stretches with no incoming cash. The CV is high. The standard deviation relative to the mean is wide. The average days between deposits is long, with high variance in that gap.
Crucially, lumpy revenue doesn't automatically mean high risk. A construction contractor with three $40,000 milestone draws per month — consistent across 12 months — represents a very different risk profile than a contractor with wildly varying draw amounts and no predictable payment cycle. Pattern stability within the lumpiness is what determines the risk level.
Business Types That Generate Lumpy Deposit Patterns
Several industries structurally produce lumpy deposit profiles:
- Construction contractors: Progress draws tied to project phases mean deposits can arrive 2–4 times per month at best, each representing large sums. Between draws, the account may go days or weeks without incoming funds. For the specific analytical challenges of construction draw loan underwriting, industry data confirms milestone payment timing creates the most irregular deposit profiles in the small business lending space.
- Event venues and caterers: Booking deposits and event-day payments cluster around event dates. A venue with 6 events in a month might show 12 deposits (booking + final payment per event), but those 12 deposits could all arrive within four specific days, leaving three-week gaps between clusters.
- Consulting and professional services: Net-30 and net-60 invoice cycles mean a firm billing $80,000 in January may not see that cash until February or March. Large invoices paid in full produce the high-amount, low-frequency pattern characteristic of lumpy revenue.
- Wholesale distributors: Purchase order payments from a small number of large clients create episodic deposit events. One client paying a $200,000 order can distort an entire month's deposit picture.
- Trucking and freight: Load payment cycles from freight brokers, depending on factoring use, create 2–4 week rhythms that produce fewer, larger deposits than daily card-settlement businesses.
Why Large One-Time Deposits Must Be Normalized
A single $80,000 contract payment in an otherwise modest month can inflate the average monthly deposit total by 200–400%. If an underwriter uses gross deposit totals without normalization, that one payment makes the business appear to have 3–5 times the sustainable cash flow it actually generates.
The problem compounds over a three-month review period: one inflated month pulls the three-month average up significantly, leading to advance sizing based on revenue the business can't consistently generate. This is the core reason why the distinction between true revenue vs. gross revenue matters so much in MCA underwriting — gross deposit totals without outlier treatment overstate the repayment capacity of lumpy revenue businesses.
A practical normalization approach: exclude the single largest deposit per monthly period, then calculate the average of the remaining deposits. This gives a conservative baseline that better represents the business's sustainable, day-to-day cash flow. For advance sizing purposes, this normalized average is the appropriate denominator — not the gross monthly deposit figure that includes outlier events.
The balance tracker visualization shows why this matters operationally: in a lumpy revenue business, account balance swings dramatically between large deposit events. Three weeks of daily MCA remittances drain the account before the next milestone payment arrives, creating the exact cash flow strain that leads to remittance failures. A recurring revenue business, by contrast, maintains a steadier balance plateau because deposits continuously replenish what remittances withdraw.
The Deposit Pattern Spectrum: From Highly Recurring to Highly Irregular
Deposit patterns are not binary. Most businesses fall somewhere between the textbook recurring case and the textbook lumpy case. Thinking in terms of a four-zone spectrum — anchored by CV ranges and representative business types — gives underwriters a more nuanced and accurate risk framework. For a deeper analysis of how bank statement velocity and repayment prediction connect, deposit velocity (total deposit dollar volume divided by days in the period) provides a rate-based metric that bridges frequency and volume into a single number.
| Zone | CV Range | Pattern Type | Representative Business Types |
|---|---|---|---|
| Zone 1 | Below 0.3 | Highly recurring | Daily card merchants, high-volume retail, QSR restaurants |
| Zone 2 | 0.3–0.5 | Moderately recurring | Mixed revenue businesses, service firms with retainer + project income |
| Zone 3 | 0.5–0.8 | Moderately lumpy | Seasonal businesses, lower-frequency invoicers, healthcare practices |
| Zone 4 | Above 0.8 | Highly irregular | Event-driven businesses, one-time contract businesses, construction |
Seasonality vs. True Irregularity: A Critical Distinction
Seasonal businesses show predictable cyclical patterns across a 12-month period. A pool maintenance company's deposit volume spikes from April through September and falls off sharply in winter. That's not irregularity — it's a business cycle. An underwriter who looks at only three months of summer data and sizes an advance accordingly has misread the risk.
True irregularity shows no predictable cycle. Deposits vary in timing and size with no seasonal logic that repeats year over year. The diagnostic test is simple: plot 12-month deposit totals month-by-month for the current year and the prior year. If the same months consistently produce higher or lower deposit volumes, the business is seasonal. If there's no repeating shape between the two years, the business is genuinely irregular.
For a complete methodology on identifying and analyzing seasonal revenue patterns across full 12-month statement sets, the 12-month trend analysis framework covers how to structure the comparison and what constitutes a consistent enough cycle to treat as seasonal rather than irregular.
Deposit Timing Within the Month: End-Loading vs. Daily Distribution
Two businesses can have identical monthly deposit totals and identical CV scores but carry very different intra-month repayment risk profiles. A business that receives 80% of its monthly deposits in the last week of the month will spend three weeks with thin cash flow — thin enough that daily MCA remittances can push the balance to zero before the month-end deposit arrives.
This end-loaded deposit timing is one of the most underappreciated risk signals in manual MCA underwriting. To identify it, review transaction-level dates within each month and calculate what percentage of monthly dollar volume arrives in each calendar week. A business showing week-four concentration (60–80% of monthly volume in the last seven days) warrants a lower holdback percentage or reduced advance size, even if its CV and monthly totals look healthy.
This intra-month timing analysis is largely absent from manual review processes because it requires transaction-level date parsing across many months — tedious to do by hand but trivial for automated analysis. It's one of the clearest examples of where manual underwriting leaves risk undetected.
Key Metrics Underwriters Use to Quantify Deposit Patterns
Qualitative impressions of a bank statement — "this looks consistent" or "this looks erratic" — introduce interpretation variance between underwriters reviewing the same file. A quantitative metric framework eliminates that variance and creates reproducible, defensible decisions. Here are the six core metrics for MCA deposit pattern analysis:
- Deposit Frequency: Count of individual deposits per month. A baseline indicator of cash flow activity. Target threshold: 15–20+ deposits per month for a strong recurring signal; fewer than 8 triggers conservative review.
- Average Deposit Size: Mean of all individual deposit amounts over the review period. Used as the denominator for CV calculation and as the baseline for advance sizing discussions.
- Deposit Standard Deviation: The standard deviation of individual deposit amounts. High SD relative to the mean indicates high variability — characteristic of lumpy revenue. Low SD indicates tight clustering around the average.
- Coefficient of Variation (CV): SD divided by the mean (CV = SD / Mean). The primary consistency index. Expressed as a decimal: 0.2 = very consistent, 0.8 = highly variable. Calculate on net deposits only — excluding identified returns, reversals, and inter-account transfers.
- Average Days Between Deposits: Total days in the review period divided by the number of deposit events, then adjusted for gaps. Measures timing predictability. A lower average with tight variance = stronger repayment signal.
- Deposit Velocity: Total deposit dollar volume divided by the number of days in the review period. Expressed as dollars per day. A rate-based metric that captures both frequency and volume in a single number, useful for comparing businesses with different deposit rhythms.
Interpreting Coefficient of Variation in Practice
A worked example makes CV concrete. Business A — a quick-service restaurant — shows 22 deposits in a month averaging $4,200, with a standard deviation of $800. CV = $800 / $4,200 = 0.19. This is a highly consistent deposit pattern. The deposits vary somewhat by day of week, but the clustering is tight. This business supports a higher advance multiple and a tighter factor rate.
Business B — a consulting firm — shows 6 deposits in the same month averaging $18,000, with a standard deviation of $14,500. CV = $14,500 / $18,000 = 0.81. This is a highly irregular deposit pattern. Some months, the firm may receive two $35,000 wire transfers; other months, a single $8,000 payment. The CV alone signals that advance sizing should be based on normalized revenue, not gross monthly totals, and the factor rate should reflect the elevated repayment risk.
One important technical note: CV calculations should always be run on net deposits — after removing returns, reversals, loan proceeds, and identified inter-account transfers. Including these items inflates apparent deposit consistency or volume and distorts the metric.
Average Daily Balance as a Complement to Deposit Pattern Metrics
CV tells you how predictable the deposits are. Average daily balance (ADB) tells you how much cushion exists between deposit events. Together, they create a two-dimensional risk view more predictive than either metric alone.
A lumpy revenue business with high CV but consistently high ADB — say, $60,000 average balance — may be lower risk than the CV alone suggests. The business has enough cash on hand to absorb daily remittances during deposit gap periods without reaching zero. Conversely, a recurring revenue business with low CV but very low ADB (say, $2,000) is more fragile than its CV suggests — any disruption to the deposit stream, even brief, could immediately fail remittance.
For the full methodology on calculating and interpreting ADB in MCA decisions, the average daily balance calculation guide covers the specific calculation approach, period selection, and how to adjust ADB for identified non-operating deposits that inflate the apparent balance cushion.
This business demonstrates strong financial health with consistent cash flow and minimal overdraft activity. Recommended for approval with standard terms.
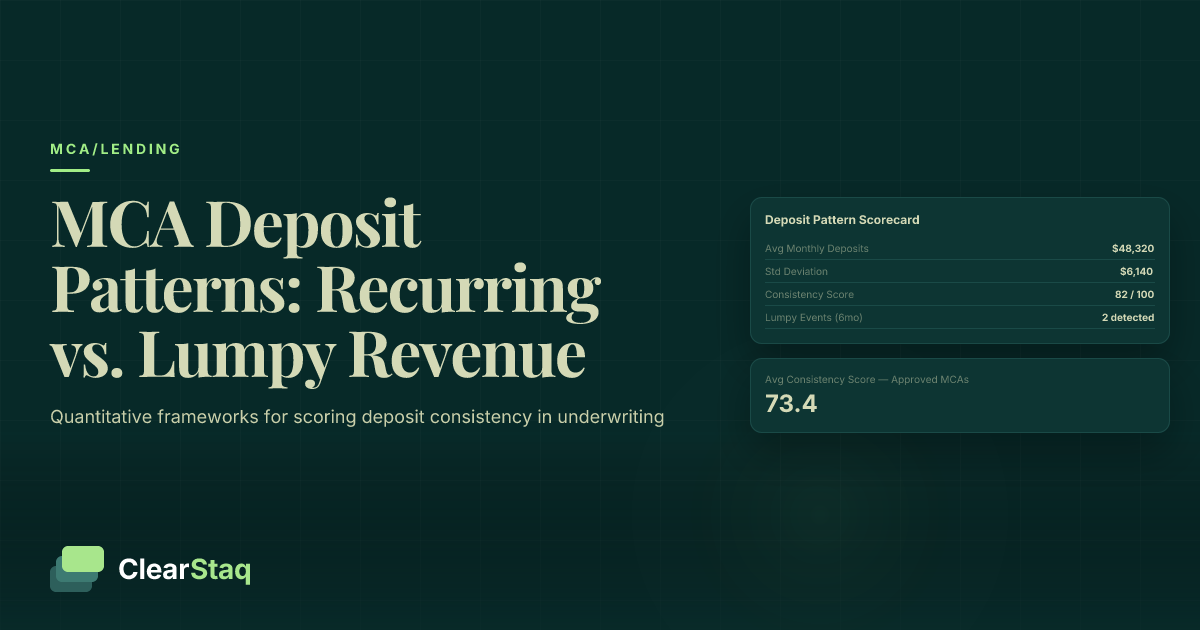
The financial scorecard above demonstrates how these individual metrics — CV, deposit frequency, ADB, and velocity — combine into a composite underwriting score. No single metric tells the full story. The multi-metric view is what separates a rigorous deposit pattern assessment from a single-number approval heuristic.
Industry-by-Industry Breakdown: Which Businesses Show Which Patterns
One of the most significant gaps in available MCA underwriting guidance is the absence of an explicit industry-to-pattern mapping. An underwriter reviewing a trucking company's bank statement should have a different mental model going in than one reviewing a restaurant's statements. Here's a practical reference table covering eight industry types:
| Industry | Typical CV Range | Deposit Frequency | Key Pattern Characteristic | Underwriting Implication |
|---|---|---|---|---|
| Full-service restaurants | 0.15–0.35 | 20–30 / month | Daily POS batch settlements; weekend volume spikes but frequency holds | Strong recurring profile; supports higher advance multiples |
| Retail with card terminals | 0.10–0.30 | 20–28 / month | Near-daily settlements; extremely dense deposit stream | Best-in-class recurring signal; lowest factor rate tier |
| E-commerce (Shopify/Amazon) | 0.20–0.45 | 6–10 / month | Bi-weekly or weekly platform payouts; consistent timing, predictable size | Moderate frequency offset by high timing predictability; standard underwriting |
| SaaS / subscription | 0.15–0.40 | 4–8 / month | Monthly or bi-weekly processor payouts; growth trajectory important | Low frequency but high timing consistency; evaluate MRR trend |
| Healthcare practices | 0.35–0.60 | 8–15 / month | Insurance reimbursements + patient payments; mixed payer timing | Moderately consistent; insurance lag creates some lumpiness |
| Construction contractors | 0.65–1.20 | 3–8 / month | Milestone-based progress draws; multi-week gaps between payments | High irregularity; normalize deposits; lower advance multiple; higher factor rate |
| Event venues / caterers | 0.70–1.10 | 4–10 / month | Booking and event-date clustering; seasonal calendar shapes volume | Lumpy profile; review booking calendar; 12-month trend essential |
| Trucking / freight | 0.50–0.85 | 6–12 / month | Load payment cycles; factoring use changes apparent pattern significantly | Moderate lumpiness; verify factoring relationship before advance sizing |
High-Frequency Deposit Industries (Recurring Profile)
Restaurants and retail businesses sit at the favorable end of the deposit pattern spectrum because their revenue model produces cash flow every single day the business is open. Card terminals close their daily batch automatically; funds arrive the next business day. There's no invoicing cycle, no waiting on client payment, no project milestone to hit. The deposit stream mirrors operational activity directly.
For full-service restaurants specifically, tip pooling and tip settlement timing can affect how deposit frequency and volume appear on statements. The nuances of restaurant cash flow and tip pooling deposit patterns are worth understanding before evaluating a restaurant's bank statement, since tip allocation timing can create apparent deposit spikes that don't reflect a change in underlying revenue.
E-commerce businesses on platform marketplaces occupy an interesting middle zone: their deposit frequency is lower (weekly or bi-weekly payouts rather than daily settlements), but the timing is highly predictable because the platform controls the payout schedule. An underwriter seeing consistent Wednesday ACH deposits from Shopify Payments every two weeks should weight timing consistency alongside frequency when scoring the pattern.
Low-Frequency Deposit Industries (Lumpy Profile)
Construction contractors represent the most challenging lumpy revenue profile in MCA underwriting. Progress draws tied to project phases mean the business may go 10–15 days without a single deposit, then receive $50,000–$150,000 when an inspector signs off on a completed phase. That payment pattern creates acute daily remittance risk between draws, particularly on longer projects where phases span multiple weeks.
Event venues face a version of this same problem with a seasonal overlay. A wedding venue may have 8 events in June and 2 in January. Within any given month, the timing of booking deposits and event-day final payments clusters around specific dates on the calendar. An underwriter who doesn't map deposit dates against the event calendar is missing the structural explanation for the pattern.
Consulting and professional services firms introduce an additional complication: their invoice cycle creates a lag between work performed and cash received. A firm that bills $100,000 in net-30 terms in January won't see those deposits until February or March. This invoice lag can make a financially healthy business look cash-constrained in any given month's bank statement.
Red Flags: When Deposit Patterns Signal Elevated Risk
Beyond classifying a business as recurring or lumpy, deposit pattern analysis should identify specific anomalies that indicate elevated repayment risk or potential fraud. The following signals warrant heightened scrutiny or additional documentation requests. Note that NSF fees and negative balance days clustering immediately after deposit gaps are particularly diagnostic — they indicate the business is already failing to bridge gaps without any MCA remittance added to the drain.
- Red Flag 1: Sudden drop in deposit frequency with no seasonal explanation — a business that averaged 22 deposits per month for four months and then drops to 6 deposits per month without a known slow season.
- Red Flag 2: Large, round-number deposits appearing infrequently — potential fraud signal. Legitimate business deposits rarely cluster at exactly $10,000, $25,000, or $50,000.
- Red Flag 3: Deposit pattern becomes suspiciously regular for a business type that should show variation — see the revenue smoothing section below.
- Red Flag 4: NSF fees and negative balance days clustering immediately after deposit gap periods — indicates the business is already unable to bridge deposit gaps under its current obligations.
- Red Flag 5: New large deposits from sources inconsistent with the declared business type — inter-account transfers or loan proceeds inflating deposit totals.
- Red Flag 6: Regular, fixed-amount ACH debits reducing the daily balance while deposit frequency remains normal — a potential indicator of existing MCA stacking.
Artificial Pattern Regularization: The Revenue Smoothing Signal
Fraudulent applicants sometimes manipulate bank statements to appear more consistent than their actual operations. The tell is a CV that is suspiciously low for the declared business type. A construction contractor showing a CV of 0.08 — near-perfect deposit consistency — is an immediate red flag. Real construction businesses don't receive milestone payments with that level of regularity.
The diagnostic question is: does the deposit pattern match the merchant category and the stated business model? A restaurant showing a CV of 0.12 is plausible — card settlements really do produce that level of consistency. A contractor showing the same CV is not plausible without a specific explanation (e.g., a long-term government contract with fixed weekly draw payments).
Cross-referencing the deposit pattern against the business type description, the merchant category code (MCC) if available, and the stated revenue mix is the first line of defense. For AI-based detection of revenue smoothing and artificial cash flow patterns, automated analysis can flag statistically anomalous consistency that human review often misses.
How Deposit Pattern Disruptions Signal MCA Stacking
MCA stacking — a merchant carrying multiple simultaneous MCA positions — appears in bank statements as regular, fixed-amount ACH debits that drain the daily balance even as deposits arrive at a normal pace. The net available balance trends downward over time despite consistent deposit activity.
The key pattern disruption signal is a declining ADB trend over three to six months with no corresponding decline in deposit frequency or volume. The business is still generating the same deposits, but each day it has less money because multiple MCA remittances are compounding against the incoming cash flow. Eventually, the deposits can no longer cover total daily remittances across all stacked positions — triggering NSF fees and failed remittances in a cascading pattern.
For the complete methodology on identifying stacking from bank statement data, the MCA stacking detection guide covers how to isolate and interpret recurring ACH debit patterns that indicate existing advance positions.
How Automated Analysis Changes Deposit Pattern Evaluation
Manual deposit pattern review — downloading a PDF, scrolling through transactions, building a spreadsheet, and calculating averages — takes an experienced underwriter 45 to 90 minutes per applicant file. That time budget limits how deeply any given file gets analyzed. Intra-month timing distributions, week-by-week deposit concentration, and multi-period trend comparisons are the first things to get cut when time is short.
Automated bank statement parsing changes this entirely. A platform that extracts every deposit transaction with date, amount, and counterparty across 900+ bank formats — and computes CV, standard deviation, deposit frequency, and velocity programmatically — removes both the time constraint and the interpretation variance between underwriters. The calculation is the same every time, for every file.
AI-driven categorization adds a critical layer: it automatically separates true revenue deposits from inter-account transfers, loan proceeds, and refunds that distort manual calculations. An underwriter manually reviewing a statement may not recognize that a recurring $15,000 deposit is a sweep from a linked business account — not revenue. Automated categorization flags it and excludes it from the deposit pattern metrics before they're calculated.
See ClearStaq's Deposit Pattern Scoring Engine in Action
See how ClearStaq automatically calculates deposit frequency, coefficient of variation, and deposit velocity from any bank statement — across 900+ bank formats. Book a demo to see the deposit pattern scoring engine in action.
From Manual Spreadsheet to Real-Time Pattern Score
The manual process is familiar to anyone who has done it: download the PDF, manually count deposits, tag each one as revenue or non-revenue, build a spreadsheet, calculate the mean and standard deviation, compute CV, repeat for three to six monthly statements, then compare. A thorough analyst doing this rigorously takes 60–90 minutes per file. A rushed one takes 15 minutes and misses the intra-month timing analysis entirely.
The automated process: upload the PDF (or submit via API), and the platform returns structured deposit data with pattern metrics pre-calculated — typically in under 30 seconds. CV, frequency, ADB, velocity, and days-between-deposit scoring are all available in the response. The underwriting team doesn't build the spreadsheet; they read the output and make the decision.
At scale, this means processing 10x more applications with the same team size — or applying the same analytical rigor that a top-tier underwriter applies manually to every single file, including the ones that previously got a lighter-touch review due to time pressure. ClearStaq's API returns deposit pattern data in structured JSON, enabling MCA funders to build scoring directly into their loan origination system or decisioning workflow through the MCA underwriting platform.
Connecting Deposit Pattern Scoring to Advance Sizing and Factor Rate
Deposit pattern metrics don't just describe risk — they should drive pricing and structure decisions directly. The connection between CV and advance terms should be explicit in any well-designed underwriting policy:
- Low CV (below 0.3) — recurring profile: Eligible for higher advance multiples (1.0–1.5x normalized monthly revenue) and tighter factor rates. Repayment risk is low.
- Moderate CV (0.3–0.6) — mixed profile: Standard advance multiples (0.75–1.0x monthly revenue), standard factor rates. Monitor ADB as a secondary indicator.
- High CV (above 0.6) — lumpy profile: Advance sizing based on normalized monthly revenue (excluding top outlier per period), not gross average. Apply a premium factor rate. Consider reduced holdback percentage (5–8% vs. 10–15%) to lower daily remittance strain.
Automated pattern scoring enables dynamic pricing rules. When CV calculation is embedded in the decisioning workflow, a threshold-based trigger can automatically adjust the proposed factor rate and holdback percentage before the file reaches an underwriter for final review — flagging high-CV files for additional scrutiny rather than letting them pass through on gross revenue figures alone.
The parsing flow visualization above shows how a raw PDF bank statement moves through automated extraction, categorization, and metric calculation — producing structured deposit pattern data that feeds directly into advance sizing and factor rate decisions. What takes an underwriter 60–90 minutes manually takes the system seconds.
Underwriting Lumpy Revenue: Conditions for Approval
Lumpy revenue businesses can qualify for MCAs. The decision framework isn't "recurring = approve, lumpy = decline." It's "does this lumpy pattern meet the conditions that make daily remittance survivable?" When the answer is yes, approval with adjusted terms is the right outcome. When the answer is no, decline protects both the funder and the merchant from a position that will likely fail.
The six conditions for approving a lumpy revenue business:
- Pattern stability: The lumpiness follows a consistent cycle year over year. The same seasonal shape or project rhythm appears in both the current and prior year's statements.
- Sufficient ADB to bridge gaps: A business maintaining $30,000–$50,000 average balance between large deposit events can absorb daily remittances during dry periods without hitting zero.
- Flat or growing revenue trend: Declining lumpy revenue is compounding risk — lower future deposits AND less predictable timing. Stable or growing normalized monthly revenue is a prerequisite for approval.
- Conservative advance sizing: Base the approved amount on normalized monthly revenue (excluding outliers), not gross averages. Apply a 0.75–1.0x multiplier rather than the 1.0–1.5x used for recurring revenue.
- Factor rate reflects the risk: A lumpy revenue business should carry a meaningfully higher factor rate than an equivalent-volume recurring business — reflecting the elevated probability of remittance gaps during deposit dry spells.
- Reduced holdback percentage: Lowering the daily remittance from 10–15% to 5–8% of daily card volume (or a lower fixed ACH amount) reduces the daily drain on the account, giving the merchant more days of survivable cash flow between large deposits.
Structuring the Advance for a Lumpy Revenue Merchant
Consider a concrete example: an event catering company with normalized monthly deposits averaging $42,000 (after excluding outlier months tied to a large corporate contract) and an ADB of $38,000. CV is 0.74. This business qualifies for consideration under the lumpy revenue framework.
Advance sizing: 0.85 × $42,000 = $35,700 approved advance. Factor rate: 1.39 (vs. 1.29 for a comparable recurring revenue business). Holdback: 7% of daily card settlements (vs. 12% standard). Review trigger: if ADB drops below $12,000 for five or more consecutive business days, flag for manual review before the next remittance cycle.
This structure gives the business access to capital while protecting the funder from remittance failure risk during the catering company's inevitable deposit gap periods. The merchant can service the advance during peak booking seasons and bridge to the next event cluster without defaulting on remittances during slow periods.
When to Decline: The Non-Negotiable Red Lines
Four conditions that should result in decline regardless of how appealing the gross revenue figures look:
- Declining deposit trend + high CV: Lower future deposits combined with unpredictable timing creates compounding risk. The business is shrinking and erratic — a combination that makes repayment unlikely even with conservative structuring.
- Lumpy pattern + NSF clustering + low ADB: The business is already failing to bridge its deposit gaps under its current obligations. Adding MCA remittances will accelerate the failure, not enable growth.
- Lumpy pattern coinciding with detected stacking: An over-leveraged position with multiple existing MCA remittances competing against lumpy deposits is an extremely high-risk combination. The business cannot service another position.
- Artificially regularized pattern for a lumpy business type: If the deposit pattern is suspiciously consistent for a business that should show high CV, the statement may be manipulated. Manual investigation is required before any decision — approval or decline.
Frequently Asked Questions
What is a good deposit pattern for MCA approval?
A good deposit pattern for MCA approval shows high frequency (15–20+ deposits per month), consistent deposit sizes with a coefficient of variation below 0.4, and no extended gaps between deposits. Daily or weekly deposits from card settlements or ACH payouts represent the strongest profile. Businesses with lower frequency deposits can still qualify with sufficient average daily balance and stable year-over-year patterns.
What is considered recurring revenue for a merchant cash advance?
Recurring revenue for MCA underwriting refers to deposit streams that arrive at regular, predictable intervals with relatively consistent amounts — such as daily POS card settlements, bi-weekly marketplace payouts, or weekly ACH remittances. It's distinguished from lumpy revenue by its deposit frequency, low coefficient of variation, and minimal gap time between deposit events.
How does lumpy or irregular revenue affect MCA eligibility?
Lumpy revenue doesn't automatically disqualify a business, but it typically results in a lower approved advance amount, a higher factor rate, and a reduced holdback percentage to manage daily remittance risk during deposit gap periods. Underwriters base advance sizing on normalized monthly revenue — excluding outlier deposits — rather than gross deposit totals.
What deposit frequency is required for MCA underwriting?
Most MCA underwriters look for a minimum of 10–15 individual deposits per month as a baseline indicator of sufficient cash flow activity. Businesses with fewer than 8 deposits per month are typically subject to closer scrutiny, conservative advance sizing, or additional conditions. Deposit frequency is evaluated alongside deposit consistency — frequent smaller deposits are generally preferred over infrequent large ones.
Can a business with seasonal revenue qualify for an MCA?
Yes, seasonal businesses can qualify for MCAs when their cyclical revenue pattern is consistent across multiple years. Underwriters differentiate genuine seasonality — a predictable annual cycle visible in 12–24 months of bank statements — from true revenue irregularity by looking for repeating seasonal shapes rather than random variation. Advance timing, sizing, and repayment terms may be structured around the business's peak season.
Make Deposit Pattern Decisions Data-Driven, Not Gut-Driven
Stop estimating deposit consistency from a manual scan. ClearStaq gives MCA underwriters a quantitative deposit pattern score on every application — so recurring and lumpy revenue decisions are data-driven, not gut-driven. Book a demo to see how the scoring engine works across 900+ bank formats.
Frequently Asked Questions
What is a good deposit pattern for MCA approval?
A good deposit pattern for MCA approval shows high frequency (15–20+ deposits per month), consistent deposit sizes with a coefficient of variation below 0.4, and no extended gaps between deposits. Daily or weekly deposits from card settlements or ACH payouts represent the strongest profile. Businesses with lower frequency deposits can still qualify with sufficient average daily balance and stable year-over-year patterns.
What is considered recurring revenue for a merchant cash advance?
Recurring revenue for MCA underwriting refers to deposit streams that arrive at regular, predictable intervals with relatively consistent amounts — such as daily POS card settlements, bi-weekly marketplace payouts, or weekly ACH remittances. It is distinguished from lumpy revenue by its deposit frequency, low coefficient of variation, and minimal gap time between deposit events.
How does lumpy or irregular revenue affect MCA eligibility?
Lumpy revenue does not automatically disqualify a business, but it typically results in a lower approved advance amount, a higher factor rate, and a reduced holdback percentage to manage daily remittance risk during deposit gap periods. Underwriters base advance sizing on normalized monthly revenue — excluding outlier deposits — rather than gross deposit totals.
What deposit frequency is required for MCA underwriting?
Most MCA underwriters look for a minimum of 10–15 individual deposits per month as a baseline indicator of sufficient cash flow activity. Businesses with fewer than 8 deposits per month are typically subject to closer scrutiny, conservative advance sizing, or additional conditions. Deposit frequency is evaluated alongside deposit consistency — frequent smaller deposits are generally preferred over infrequent large ones.
Can a business with seasonal revenue qualify for an MCA?
Yes, seasonal businesses can qualify for MCAs when their cyclical revenue pattern is consistent across multiple years. Underwriters differentiate genuine seasonality — a predictable annual cycle visible in 12–24 months of bank statements — from true revenue irregularity by looking for repeating seasonal shapes rather than random variation. Advance timing, sizing, and repayment terms may be structured around the business's peak season.
ClearStaq Team
Product Team
The ClearStaq team builds AI-powered tools for bank statement parsing, fraud detection, and income verification.