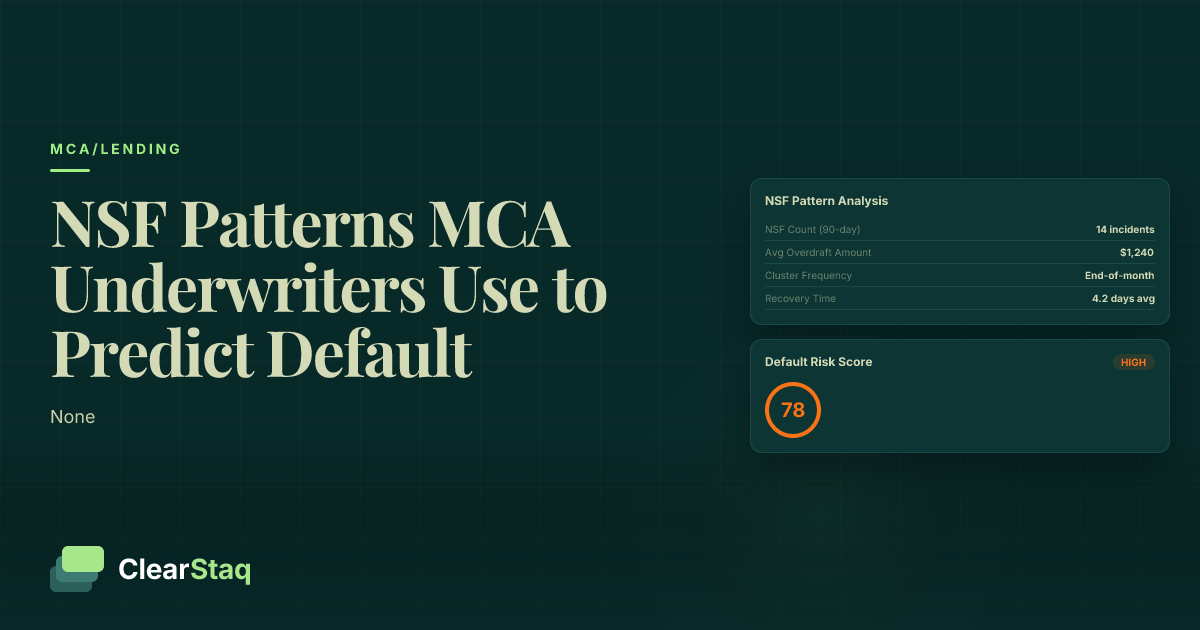
NSF frequency analysis examines how often a business triggers non-sufficient funds charges across a statement window, treating overdraft patterns as a leading indicator of cash flow stress and default risk. MCA underwriters evaluate NSF count, clustering, trend direction, and timing relative to payroll and ACH pulls to distinguish isolated incidents from structural liquidity problems.
What you'll learn
- NSF frequency is a real-time cash flow signal that predicts MCA default risk more directly than credit scores or tax returns
- Rolling 30-day windows reveal NSF clusters that calendar-month analysis routinely conceals, particularly when shortfalls span month boundaries
- Five distinct NSF patterns — end-of-month clustering, post-remittance shortfalls, accelerating frequency, paired returned ACH items, and stacking-correlated escalation — each carry materially different default risk implications
- The NSF-to-revenue ratio contextualizes raw NSF count against revenue scale; a ratio above 1.5% is a high-risk signal regardless of absolute event count
- Automated bank statement parsing extracts NSF events, trend direction, timing correlations, and the NSF-to-revenue ratio across 900+ bank formats in a single API call, eliminating the compounding errors of manual review
NSF frequency analysis examines how often a business triggers non-sufficient funds charges across a statement window, treating overdraft patterns as a leading indicator of cash flow stress and default risk. MCA underwriters evaluate NSF count, clustering, trend direction, and timing relative to payroll and ACH pulls to distinguish isolated incidents from structural liquidity problems.
What Is NSF Frequency Analysis? (And Why MCA Underwriters Rely on It)
A non-sufficient funds charge appears on a business bank statement when a payment is attempted and the account doesn't have enough cash to cover it. The transaction is declined or returned, and the bank charges a fee — typically $25 to $50 per event. That fee is the visible signal. What it represents is something far more important to an MCA underwriter: a moment when the business ran out of money before its obligations cleared.
Traditional lenders rely on FICO scores and tax returns to assess borrower risk. MCA underwriters don't have that luxury — or that need. MCA advances are repaid daily or weekly from incoming revenue. The relevant question isn't "what was this business's credit score three years ago?" It's "does this business have enough cash flow to absorb a daily remittance pull without failing?" NSF frequency answers that question directly.
That's what makes NSF analysis MCA underwriting's most actionable signal. It's not a lagging indicator like a credit score. It's a real-time window into how often a business's cash position collapses before obligations are met — a direct preview of how it will handle remittance pulls.
This post covers five dimensions of NSF analysis that separate sophisticated underwriters from those who only count raw totals: NSF count, clustering, timing, trend direction, and the NSF-to-revenue ratio. Each dimension adds a layer of precision that raw count alone can't provide. For foundational context on what these signals represent at the account level, see our overview of NSF fees, overdrafts, and negative balance days in borrower risk assessment.
NSF vs. Overdraft: What Underwriters Actually See on a Statement
These two terms are often used interchangeably, but they describe different outcomes on a bank statement. An NSF (non-sufficient funds) event means the bank declined the transaction and returned it unpaid — the payment failed. An overdraft means the bank covered the shortfall, allowing the transaction to go through while pushing the account balance below zero.
Both appear as line items on a business bank statement, but they look different. An NSF charge typically shows a description like "NSF FEE," "INSUFFICIENT FUNDS CHG," or "RETURNED ITEM FEE." An overdraft appears as an "OVERDRAFT FEE" or "OD FEE" alongside a negative running balance. Returned ACH items — where an ACH debit is rejected and sent back to the originator — are a related but distinct signal, appearing as "ACH RETURN," "RTN ACH," or similar descriptions.
From a risk perspective, the root cause is identical: the account didn't have enough cash to cover what was owed. Overdraft protection masks the NSF event but doesn't eliminate the underlying shortfall — and it produces negative balance days that are just as meaningful to an underwriter as the fee itself.
Why MCA Lenders Weight NSFs Differently Than Traditional Banks
A traditional bank reviewing a business loan application might note NSF history as a negative mark alongside dozens of other factors. The advance term might be 5 years, so a few rough months two years ago barely register.
MCA underwriting compresses that risk horizon dramatically. A 6-month advance with daily remittance pulls means the underwriter needs to know: right now, this week, this month — can this business absorb a daily debit? NSF history from the past 90 days isn't a footnote. It's the primary evidence.
Every NSF event in the recent statement window is a data point showing what happens when cash gets tight. And in an MCA structure, remittance pulls make cash tight every single day.
The Anatomy of an NSF: What Shows Up on a Business Bank Statement
Before you can analyze NSF frequency, you need to correctly identify NSF events in raw statement data. This is harder than it sounds. Across 900+ bank formats, the same underlying event appears under dozens of different description strings, in different columns, with varying fee amounts and different line item sequences relative to the triggering transaction.
The table above illustrates how NSF line items appear within parsed transaction data — notice how the description string, fee amount, and running balance impact all need to be identified and correctly classified before any frequency calculation can begin.
How to Identify NSF Line Items Across Bank Formats
The most common NSF description strings across major bank formats include:
- Chase: "NSF FEE," "INSUF FUNDS FEE," "RETURNED ITEM FEE"
- Bank of America: "NSF: RETURNED ITEM," "INSUFFICIENT FUNDS FEE"
- Wells Fargo: "RETURNED CHK FEE," "NSF FEE," "OD/NSF FEE"
- Regional banks: "RTN DEP ITEM," "NSF CHARGE," "NON-SUFFICIENT FUNDS," "ITEM RETURNED"
Returned ACH items appear separately and require their own identification logic: "ACH RETURN FEE," "RTN ACH ITEM," "ACH RTN," or simply "RETURN FEE" depending on the institution. These are not NSF fees, but they signal the same cash shortfall and must be tracked independently.
Manual review introduces significant error risk here. An analyst reviewing scanned statements via OCR may misread "NSF FEE" as a standard service charge, or miss a returned ACH item entirely because it appears on a different page than the triggering debit. The format differences across major banks make consistent manual extraction unreliable at scale.
Negative Balance Days vs. NSF Frequency: Two Different Signals
NSF frequency is the count of NSF events within a defined window — how many times the account triggered an insufficient funds charge. Negative balance days is the count of calendar days where the account's end-of-day balance fell below zero, regardless of whether a fee was charged.
These two metrics often correlate but don't always move together. A business with overdraft protection might have zero NSF charges but 18 negative balance days in a month — the bank covered every shortfall. A business without overdraft protection might have 4 NSF charges but only 4 negative balance days, each resolved the same day. The first business has more severe cash dysfunction despite lower NSF count.
Both metrics belong in every underwriting analysis. Neither substitutes for the other.
Isolated vs. Chronic: Reading the Pattern Behind Overdraft History
Two businesses can each show 6 NSFs in a 3-month statement window and represent completely different risk profiles. The difference isn't the count — it's the pattern.
An isolated NSF is a single event tied to an identifiable, non-recurring cause: a vendor erroneously double-debited the account, a large check was deposited and then reversed, a one-time tax payment created an unexpected shortfall. These happen to healthy businesses. They don't predict future default.
A chronic NSF pattern is a recurring signal across multiple months with no identifiable resolution. The business keeps running out of cash before obligations clear. That's not a one-time event — it's a structural cash flow gap. And that gap doesn't disappear when you fund them; it gets worse, because now they have a daily remittance pull on top of it.
The distinction requires analyzing NSF events within rolling 30-day windows rather than by calendar month. This is critical: three NSFs in the last 10 days of Month 2 and three more in the first 5 days of Month 3 looks like two to three per month in a calendar view. In a rolling window view, it's a 10-day cluster of 6 NSFs — a materially different and more alarming signal.
Recency weighting compounds this. Three NSFs in the most recent 30-day window are more predictive of default than eight NSFs from 90 days ago. The underwriter's question is "what will this business do in the next 6 months?" The most recent behavior is the most relevant evidence.
How to Spot an Improving NSF Trend vs. a Worsening One
Trend direction is often more important than raw NSF count when making an underwriting decision. Here's how each trend type presents:
| Trend Type | What It Looks Like | Risk Implication |
|---|---|---|
| Improving | NSF count declining month-over-month; most recent 30-day window is clean or near-clean | Reduced risk; may qualify with compensating factors |
| Worsening | NSF count accelerating; most recent window shows highest frequency in the statement period | High risk; trend suggests further deterioration under remittance pressure |
| Plateau | Consistent low-level NSFs that never resolve across 3+ months | Chronic structural issue; the business has normalized operating at the edge of its cash position |
| Isolated spike | One high-NSF month surrounded by clean windows on both sides | Lower risk if a credible one-time explanation exists |
Document trend direction explicitly in the underwriting memo. A worsening trend with only 4 NSFs per month is more concerning than an improving trend with 6.
Why a Recent Clean Period Doesn't Always Clear the Risk
A clean 30-day window at the end of a statement period looks encouraging, but it requires context before it changes the risk decision. Seasonal businesses — restaurants, landscapers, retail shops — frequently show temporary NSF improvement during peak revenue periods. That clean window may simply reflect high-season cash flow that will reverse in three months.
Cross-reference the clean period against the business's revenue seasonality. If deposit volume in the clean window is 40% higher than the NSF-heavy months, the improvement may be seasonal rather than structural. For methodology on validating this, see our guide to seasonality analysis in bank statements.
Merchants who've recently received a new MCA position from another funder may also show a temporary balance lift — the incoming advance capital inflates their account balance, producing a clean window that masks deteriorating operating cash flow underneath.
5 NSF Patterns That Predict MCA Default Risk
Raw NSF count is a starting point, not a conclusion. These five named patterns are what separates underwriters who catch default risk early from those who miss it until a pull fails. No competitor documents all five. Each pattern includes what it looks like on a statement, what it signals about cash flow, and how it changes the risk decision.
Pattern 1: End-of-Month NSF Clustering
NSF events concentrated in the last 5 business days of each calendar month — consistently, across multiple months — indicate that the business exhausts its operating cash before the next revenue cycle begins. This pattern correlates strongly with fixed monthly obligations: rent, payroll, insurance premiums, or loan payments that hit before the next wave of customer deposits arrives.
A business showing this pattern has a predictable cash gap at a specific, recurring point in the operating cycle. Once an MCA remittance pull is layered on top, that gap widens. The default risk isn't hypothetical — it's calendared.
Pattern 2: NSFs Immediately Following MCA Remittance Pulls
This is the highest-urgency pattern in NSF analysis MCA underwriting. When NSF events appear 1 to 2 business days after a detected MCA remittance debit, it signals that the advance payment itself is pushing the account into shortfall.
The implication is direct: the business can't absorb its own repayment obligation. The factor rate is unsustainable relative to actual cash generation. Extending additional capital to a merchant showing this pattern doesn't solve the problem — it accelerates it, because the new advance adds another daily debit to an account that's already failing to recover from the previous one.
Pattern 3: Accelerating NSF Frequency Across the Statement Window
Linear NSF growth is a warning. Exponential growth is an emergency. When NSF frequency follows a pattern like 1 NSF in Month 1, 3 in Month 2, and 6 in Month 3, the trend isn't just worsening — it's compounding. Each month's cash position is starting from a lower baseline than the month before.
This acceleration pattern should trigger automatic escalation to senior underwriter review, regardless of what the average daily balance shows. Average daily balance can look acceptable even as NSF frequency accelerates, because large deposit events elevate the average while the account regularly hits zero between them. The two signals must be evaluated together.
Pattern 4: NSFs Paired With Returned ACH Items in the Same Week
When NSF fees and returned ACH items both appear within the same 5- to 7-day window, it indicates that multiple payment obligations failed simultaneously. This isn't one payment catching the account at a low point — it's a systemic shortfall affecting multiple creditors at once.
The compounding signal matters here. Returned ACH items may not always generate a separate NSF fee depending on account type and bank policy, which means tracking only NSF fee line items systematically undercounts the actual number of failed payment events. An underwriter who filters for NSF fees only will miss half the picture when returned ACH items are present.
Pattern 5: Stacking-Correlated NSF Escalation
When NSF frequency increases in direct correlation with the appearance of new MCA remittance payee entries on the bank statement, the connection is causal, not coincidental. Each new MCA position adds another fixed daily debit to the account. Each additional debit compresses operating cash further. NSF frequency climbs because the account's sustainable operating balance keeps shrinking.
Merchants with three or more active MCA positions and rising NSF frequency represent the highest default risk tier in MCA underwriting. The math is simple: multiple daily remittance pulls against a fixed revenue base will eventually consume more cash than the business generates. For methodology on identifying position stacking from statement data, see our guide to MCA stacking detection.
These five patterns don't operate independently. A merchant showing end-of-month clustering (Pattern 1), post-remittance NSFs (Pattern 2), and stacking-correlated escalation (Pattern 5) simultaneously doesn't have three separate risk factors — they compound each other non-linearly. The combined risk profile is materially worse than any single pattern in isolation.
How to Calculate NSF Frequency and Negative Balance Days
Here's the step-by-step methodology underwriters can apply manually or use to audit automated outputs. Precision in these calculations matters because small differences in methodology can change the risk tier classification on borderline applications.
NSF frequency (monthly normalized rate):
- Count all NSF fee line items within the rolling 30-day window
- Divide by the number of banking days in that window
- Multiply by 30 to normalize to a monthly rate
Negative balance days:
- Examine the running balance column for each calendar day in the statement period
- Count any day where the end-of-day closing balance is below $0.00
- Track both total count and maximum consecutive streak separately
General threshold guidelines for NSF frequency in a 30-day window:
| NSF Count (30-Day Window) | Risk Classification | Underwriting Action |
|---|---|---|
| 0–2 | Low risk | Standard processing; note pattern type |
| 3–5 | Elevated / manual review zone | Request explanation; evaluate compensating factors |
| 6+ | High risk | Hard decline unless extraordinary compensating factors exist |
These are guidelines, not absolute rules. Trend direction and pattern type can shift a 5-NSF profile into decline territory or pull a 7-NSF profile into manual review if the compensating factors are strong enough.
The Rolling 30-Day Window: Why Calendar Months Distort the Signal
Calendar month analysis is the default for most manual underwriting processes. It's also the approach most likely to miss the worst NSF clusters. When 5 NSFs appear in the last 10 days of one calendar month and 5 more in the first 5 days of the next, a calendar view reports 5 NSFs per month. A rolling window view reveals a 10-day cluster of 10 NSFs — a materially different and far more alarming signal.
Most automated tools default to calendar month windows. Underwriters reviewing automated outputs should specifically request rolling 30-day data to validate what the calendar view may be smoothing over. The rolling window captures true frequency regardless of where statement periods fall relative to the actual NSF cluster.
Negative Balance Duration vs. Frequency: Which Signals Deeper Distress
A business with 12 consecutive negative balance days has more severe cash flow dysfunction than one with 6 separate single-day negative events, even if the raw count is similar. Duration signals a structural inability to maintain positive operating balances — the account goes negative and stays there. Frequency signals recurring but recoverable shortfalls — the account dips below zero and bounces back each time.
Both metrics should be reported alongside each other in the underwriting file, never as substitutes. Negative balance days directly suppress average daily balance calculations, which affects advance sizing decisions as well as approval/decline determinations.
Timing Matters: What NSF Clustering Reveals About Cash Flow Cycles
The date an NSF event occurs is as analytically significant as the event itself. Two businesses with identical NSF counts can have completely different cash flow structures depending on when those NSFs hit relative to their operating cycle. Timing analysis turns raw NSF data into a cash flow map.
There are four timing patterns that carry the most underwriting weight: NSFs relative to payroll dates, NSFs relative to ACH debits, NSFs relative to deposit cycles, and month-end versus mid-month clustering. Each reveals something specific about where the business's cash flow breaks down — and how an MCA remittance pull will interact with that break point.
Payroll-Correlated NSFs: The Structural Cash Flow Warning
When NSFs consistently appear on or just before the 1st and 15th of each month — common payroll dates — the business is funding payroll with incoming revenue rather than from reserves. There is no operating buffer. The business is running at the margin of its own revenue cycle.
This pattern is particularly common in restaurants, staffing firms, and retail businesses during slow seasons. The structural implication is severe: any deposit delay of 24 to 48 hours — a bank processing lag, a weekend, a slow revenue day — produces a payroll-related NSF. Add a daily MCA remittance pull and the probability of that delay becomes near-certain.
Cross-reference NSF timing with deposit frequency and transaction velocity analysis to confirm whether the payroll correlation is structural or situational.
How Remittance Timing Amplifies NSF Risk
MCA funders typically process daily remittance debits at fixed times — often early morning. If those debits hit the merchant's account before that day's incoming deposits process, the account may be temporarily below the remittance amount even if the business generates sufficient daily revenue overall. That timing mismatch produces structural NSF risk that doesn't reflect the business's actual cash generation capacity.
Underwriters who identify this pattern can treat it as an operational rather than financial risk — adjustable through deal structuring. Shifting remittance timing to later in the banking day, or converting from daily to weekly remittance for marginal applications, can eliminate this category of NSF risk without changing the advance amount or factor rate. This is one area where a nuanced NSF analysis MCA underwriting approach creates deal flow that a blunt risk filter would reject unnecessarily.
NSF-to-Revenue Ratio: A Framework MCA Underwriters Actually Use
Raw NSF count strips away the most important contextual variable: how much revenue is flowing through the account? Six NSFs on $500,000 per month in gross deposits is a rounding error. Six NSFs on $40,000 per month in gross deposits is a business that may be losing 3% to 5% of its operating revenue to bank penalties alone — before any advance payment is factored in.
The NSF-to-revenue ratio normalizes NSF activity against the revenue base it's occurring within. It's calculated as total NSF fees charged divided by total gross deposits in the same window, expressed as a percentage. This ratio answers the question no raw count can: how much of this business's cash flow is being consumed by the evidence of its own cash shortfalls?
Calculating NSF-to-Revenue Ratio Step by Step
- Step 1: Sum all NSF fee charge amounts across the statement window — fee line items only, not the amount of the returned transaction itself
- Step 2: Sum all incoming deposit amounts for the same window using gross deposits, not net of any returns
- Step 3: Divide total NSF fees by gross deposits and express as a percentage
- Step 4: Repeat this calculation for each statement month in the submission and track the direction of the ratio over time
Benchmark thresholds for NSF-to-revenue ratio:
- Under 0.5%: Acceptable — NSF activity is immaterial relative to revenue scale
- 0.5% to 1.5%: Elevated — warrants investigation into pattern type and trend direction
- Above 1.5%: High risk — the business is paying a meaningful percentage of its revenue in NSF penalties, indicating chronic cash flow dysfunction
A merchant paying $3,000 per month in NSF fees on $60,000 in monthly revenue is losing 5% of gross revenue to bank penalties before a single business expense is paid. That ratio, combined with a daily MCA remittance obligation, describes a business that cannot remain current on its advance under normal operating conditions.
This business demonstrates strong financial health with consistent cash flow and minimal overdraft activity. Recommended for approval with standard terms.
When NSF-to-Revenue Ratio Tells a Different Story Than NSF Count
The ratio surfaces risk that count-based analysis systematically misses. A high-revenue business with 8 NSFs may show a ratio of 0.3% — immaterial. A low-revenue business with 3 NSFs may show a ratio of 2.1% — a hard decline signal. If you're only counting NSFs, you approve the wrong application and decline the right one.
The ratio also captures fee escalation even when count stays flat. Some banks charge higher NSF fees to accounts with frequent prior events — a tier-based penalty system. A business paying $75 per NSF rather than $35 is a different risk signal even if the event count is identical, and the ratio captures that difference automatically.
Trend the ratio across multiple months alongside trend direction and pattern type for a complete risk picture. A rising NSF-to-revenue ratio even without rising NSF count indicates that the business's revenue base is shrinking relative to its overdraft activity — a deteriorating situation by any measure.
When NSFs Are a Yellow Flag vs. a Hard Decline
NSF history is not automatically disqualifying. The underwriting judgment — approve, decline, or manual review — depends on a combination of pattern type, trend direction, ratio, timing, and compensating factors. Here's a practical decision framework.
Yellow flag (manual review with potential approval):
- Isolated NSF events with an identifiable, documented one-time cause
- Improving trend with a clean recent 30-day window
- NSF-to-revenue ratio under 0.5%
- No clustering around remittance dates or payroll periods
- Strong average daily balance that demonstrates a liquidity cushion despite occasional shortfalls
Manual review zone (3-5 NSFs with mixed signals):
- Moderate NSF frequency with no clear trend direction
- Some clustering but not consistent month-over-month
- NSF-to-revenue ratio in the 0.5% to 1.5% range
- Request merchant explanation and evaluate compensating factors before deciding
Hard decline criteria:
- 6 or more NSFs in the most recent 30-day window
- Accelerating trend (Pattern 3) regardless of absolute count
- NSF events appearing 1–2 days after MCA remittance pulls (Pattern 2)
- NSF-to-revenue ratio above 1.5%
- Stacking-correlated NSF escalation (Pattern 5) with 3+ active MCA positions
Compensating Factors That Can Offset NSF Risk
A yellow-flag NSF profile can qualify if compensating factors are genuine and verifiable:
- Rising deposit trend: Month-over-month deposit volume growth that outpaces NSF frequency growth — revenue is accelerating faster than shortfall events
- Strong, stable average daily balance: Demonstrates that a liquidity cushion exists despite occasional dips below zero
- Documented one-time cause: A returned check from a major client, a bank error, a disputed ACH that was subsequently resolved — credible and supported by the statement timeline
- Clean 45–60 day recent window: Sustained improvement, not a single clean week, following a previously elevated period
How NSF Risk Interacts With Advance Sizing Decisions
Even yellow-flag NSF profiles may qualify for a smaller advance at a higher factor rate. The key question is: what daily remittance amount can this merchant absorb given the balance levels that previously triggered NSF events?
Stress-test the proposed daily remittance against the account's demonstrated low-balance windows. If NSF events previously occurred when the balance dropped below $2,000, and the proposed daily debit is $800, the underwriter needs to verify that the average low-balance day still leaves sufficient margin after the pull. For the full decision framework context, see the MCA underwriting checklist.
How Automated Analysis Changes NSF Detection at Scale
Manual NSF review has compounding failure points. Human analysts miss description string variations across bank formats. They miscategorize returned ACH items as something other than cash shortfall signals. They default to calendar month windows instead of rolling 30-day windows. They can't trend NSF metrics across three months of statements simultaneously. And they take 20 to 40 minutes per application to do it imperfectly.
The parsing pipeline above illustrates how bank statement data flows from raw document through extraction, classification, and risk signal computation — the foundation of automated NSF analysis at scale.
What ClearStaq Extracts From a Bank Statement for NSF Analysis
ClearStaq automatically extracts and classifies NSF line items across 900+ bank formats without manual review. For every statement submitted, the system computes:
- NSF event count per rolling 30-day window across all statement months submitted
- NSF clustering detection: flags when 3 or more NSF events appear within any 7-day window
- Trend direction output: classified as "improving," "worsening," or "stable" based on month-over-month frequency delta
- NSF timing correlation: flags events occurring within 2 business days of detected MCA remittance debits
- Returned ACH items: extracted and reported separately from NSF fees for granular analysis
- Negative balance days: total count and maximum consecutive streak per statement period
- NSF-to-revenue ratio: computed for each statement month and trended across the full submission
All outputs are available as structured JSON fields in a single API response. NSF frequency is one of the 27 fraud and risk signals integrated into ClearStaq's unified risk score. Real-time webhook alerts fire when NSF thresholds are breached during a live underwriting pipeline, allowing underwriters to flag applications before they advance to the next stage.
Cross-Statement NSF Analysis: Why Single-Month Review Misses the Trend
A single month of statements cannot reveal trend direction — which is, as we've established, the most predictive signal in NSF analysis MCA underwriting. You need at least two months to detect movement, and three to confirm a trend. Acceleration patterns (Pattern 3) are invisible in single-statement review.
ClearStaq accepts 3 to 12 months of statements in a single API call and trends all NSF metrics across every submitted period simultaneously. The system surfaces the acceleration pattern that single-statement review always misses, the stacking-correlated escalation that requires cross-referencing remittance payees across months, and the seasonal improvement that looks like genuine recovery until you compare it against the same period last year.
All processing occurs within ClearStaq's SOC2-compliant infrastructure, ensuring that sensitive bank statement data is handled securely at scale — critical for underwriting teams processing hundreds of applications per week. Learn more about the MCA underwriting platform and how it integrates into existing deal pipelines.
See ClearStaq's NSF Analysis in Action
See how ClearStaq extracts NSF frequency, clustering patterns, and NSF-to-revenue ratio from any bank statement format — in seconds. Book a demo to walk through a live underwriting analysis.
FAQ: NSF Frequency Analysis in MCA Underwriting
What does NSF frequency tell you about a borrower?
NSF frequency reveals how often a business runs out of operating cash before its obligations clear — a direct proxy for cash flow management and liquidity discipline. High NSF frequency, especially when clustered or accelerating, indicates structural shortfalls rather than one-time events. It's one of the most reliable early-warning signals for MCA default risk because it reflects real-time cash behavior, not historical credit data.
How many NSFs are too many for MCA approval?
As a general guideline, 0–2 NSFs per 30-day window represents low risk, 3–5 triggers manual review, and 6 or more in the most recent window typically results in a hard decline. Raw count must be evaluated alongside trend direction, NSF-to-revenue ratio, and clustering patterns — a worsening trend of 4 NSFs per month is more concerning than a stable 5 with an improving recent window and strong compensating factors.
What is a negative balance day in bank statement analysis?
A negative balance day is any calendar day on which a business account's end-of-day balance falls below zero, regardless of whether an NSF fee was charged. Negative balance days differ from NSF frequency in that they measure the duration of cash shortfall rather than the count of individual events. A business with 12 consecutive negative balance days shows deeper structural distress than one with 6 scattered single-day negatives, even at the same total count.
Can a business with NSF history still qualify for an MCA?
Yes, depending on the pattern and compensating factors. Businesses with an improving NSF trend, a clean recent 30–45 day window, a strong average daily balance, and NSF events tied to a documented one-time cause may still qualify — often at a reduced advance amount or adjusted factor rate. Chronic, accelerating, or stacking-correlated NSF patterns are far less likely to qualify regardless of compensating factors.
How do you calculate overdraft frequency from a bank statement?
Count all NSF fee line items within a rolling 30-day window, then normalize to a monthly rate by dividing by the number of banking days in the window and multiplying by 30. Complement this with a separate count of returned ACH items — they signal the same cash shortfall but appear as distinct line items and are often excluded from NSF-only counts, leading to systematic undercounting of actual failed payment events.
What cash flow signals predict MCA default risk?
The strongest predictors include NSF frequency and trend direction, negative balance days, NSF-to-revenue ratio, declining average daily balance, and the presence of multiple MCA remittance payees indicating stacking. NSF events occurring immediately after MCA remittance pulls are a particularly high-risk signal — they indicate the repayment obligation itself is destabilizing the merchant's cash position, making early default highly probable.
Stop Missing the Patterns That Predict Default
Manual NSF review misses the patterns that actually predict default. ClearStaq surfaces NSF clustering, trend direction, and remittance-correlated shortfalls automatically — so your underwriting team focuses on decisions, not data extraction. Book a demo today.
Frequently Asked Questions
What does NSF frequency tell you about a borrower?
NSF frequency reveals how often a business runs out of operating cash before its obligations clear — a direct proxy for cash flow management and liquidity discipline. High NSF frequency, especially when clustered or accelerating, indicates structural shortfalls rather than one-time events. It's one of the most reliable early-warning signals for MCA default risk because it reflects real-time cash behavior, not historical credit data.
How many NSFs are too many for MCA approval?
As a general guideline, 0–2 NSFs per 30-day window represents low risk, 3–5 triggers manual review, and 6 or more in the most recent window typically results in a hard decline. Raw count must be evaluated alongside trend direction, NSF-to-revenue ratio, and clustering patterns — a worsening trend of 4 NSFs per month is more concerning than a stable 5 with an improving recent window and strong compensating factors.
What is a negative balance day in bank statement analysis?
A negative balance day is any calendar day on which a business account's end-of-day balance falls below zero, regardless of whether an NSF fee was charged. Negative balance days differ from NSF frequency in that they measure the duration of cash shortfall rather than the count of individual events. A business with 12 consecutive negative balance days shows deeper structural distress than one with 6 scattered single-day negatives, even at the same total count.
Can a business with NSF history still qualify for an MCA?
Yes, depending on the pattern and compensating factors. Businesses with an improving NSF trend, a clean recent 30–45 day window, a strong average daily balance, and NSF events tied to a documented one-time cause may still qualify — often at a reduced advance amount or adjusted factor rate. Chronic, accelerating, or stacking-correlated NSF patterns are far less likely to qualify regardless of compensating factors.
How do you calculate overdraft frequency from a bank statement?
Count all NSF fee line items within a rolling 30-day window, then normalize to a monthly rate by dividing by the number of banking days in the window and multiplying by 30. Complement this with a separate count of returned ACH items — they signal the same cash shortfall but appear as distinct line items and are often excluded from NSF-only counts, leading to systematic undercounting of actual failed payment events.
What cash flow signals predict MCA default risk?
The strongest predictors include NSF frequency and trend direction, negative balance days, NSF-to-revenue ratio, declining average daily balance, and the presence of multiple MCA remittance payees indicating stacking. NSF events occurring immediately after MCA remittance pulls are a particularly high-risk signal — they indicate the repayment obligation itself is destabilizing the merchant's cash position, making early default highly probable.
ClearStaq Team
Product Team
The ClearStaq team builds AI-powered tools for bank statement parsing, fraud detection, and income verification.